
Gantt Chart PowerPoint PPT Presentations
All Time
Recommended

Gantt Charts Basics Tasks in a planned project are bars Dependent tasks are linked by arrows Progress may be overlaid Milestones & deadlines may be added Good for ...
| PowerPoint PPT presentation | free to view


This presentation educates you about Tableau - Gantt Chart and Creating a Gantt Chart in step by step with example gantt chart. For more topics stay tuned with Learnbay.
| PowerPoint PPT presentation | free to download

Microsoft Excel. Easy, flexible, use colors. Microsoft Project. The ultimate Gantt Chart creator. Gantt Chart Created in Excel. ISO 9000 Audit Schedule. Microsoft ...
| PowerPoint PPT presentation | free to download
Source: Capers Jones, Software Productivity Research. Language. LOC/Function ... Top Down Task Identification. Phases. Phases with. high ... PERT Chart for the ...
| PowerPoint PPT presentation | free to download

During World War I (1910s), he studied manufacturing processes and labor ... For scheduling, it is critical to understand precedence of relationships between tasks ...
| PowerPoint PPT presentation | free to view

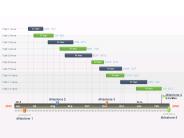
Gantt charts are essential tools for managing projects, and think-cell makes it easy to create and adjust them. To start, you can insert a Gantt chart directly from the think-cell toolbar, which helps visualize your project's timeline. Modifying the chart is simple; you can change task start and end dates by dragging the bar edges or entering new dates in the data sheet. Gantt charts are commonly used for software development projects, illustrating phases like planning, design, development, and testing. They can serve various purposes, such as scheduling tasks, tracking project progress, and improving team communication. By using think-cell's user-friendly features, you can improve your project management approach and ensure your timelines are clear and actionable.
| PowerPoint PPT presentation | free to download

For Assignment Solution Contact Casestudyhelp.in https://www.casestudyhelp.in 9422028822
| PowerPoint PPT presentation | free to download
MIT University of Shillong is an institute that understands the current skills gap in the market and strives hard to reduce it. Hence, MIT University brings you Executive MBA in Project Management. This EMBA Project Management course covers the concepts like running a successful project, foundations of Agile project management and Scrum and skills required for the successful execution of a project.
| PowerPoint PPT presentation | free to download

A Gantt chart is a visual tool used to display project timelines and tasks. It includes four main components: tasks, time frame, progress, and dependencies. To create an effective Gantt chart, seven key elements should be incorporated: task names, start and end dates, duration, milestones, assigned resources, progress indicators, and task dependencies. This chart not only shows the schedule of a project but also highlights how tasks overlap and evolve over time. The name "Gantt" comes from Henry Gantt, an American engineer and management consultant who developed this project management tool in the 1910s. By understanding these components and elements, one can create a Gantt chart that improves project planning and monitoring, making it easier to track progress and manage tasks efficiently.
| PowerPoint PPT presentation | free to download
Project Management by Gantt Chart & PERT Diagram Start Sanchai Yeewiyom School of Information & Communication Technology University of Phayao Next
| PowerPoint PPT presentation | free to download
Wide screen, editable PowerPoint Gantt chart template for project management.
| PowerPoint PPT presentation | free to download

LECTURE 5 GANTT CHART GANTT Charts Constructing GANTT Charts Staffing and Re-scheduling Project Management Software * Maria Petridou Software Project Management
| PowerPoint PPT presentation | free to view

Safety and Gantt Charts ChE 477 (UO Lab) Larry Baxter & Stan Harding Brigham Young University Outline Lab safety. General location of fire pulls (building exits).
| PowerPoint PPT presentation | free to download
The Gantt chart shows the timeline of a project, and it can be used at work to enhance team unity through team-building activities. Gantt charts foster collaboration by providing a shared platform for team members to view and update task progress. For more information, visit: www.acteamo.com.
| PowerPoint PPT presentation | free to download

Gantt and PERT charts Representing and Scheduling Project Plans Gantt Charts Useful for depicting simple projects or parts of large projects Show start and completion ...
| PowerPoint PPT presentation | free to view

ECE 480 Gantt Charts Revisited Keys to Successful Gantt Charts USE the default, finish-to-start, constraints obtained by specifying predecessors, unless you KNOW you ...
| PowerPoint PPT presentation | free to download

To help project managers succeed, Gantt charts are powerful tools that make organizing projects easy and fast. Take a look at the points highlighting the importance of Gantt Charts in Project Management.
| PowerPoint PPT presentation | free to download
GanttPRO helps 500k+ people become better managers for their teams and more professional service providers for their clients. Online project management solution based on Gantt charts. Keep your planning simple, team members - engaged, clients - in the loop!
| PowerPoint PPT presentation | free to download

Creating Gantt Charts In Excel Kelly N. Carter What Is A Gantt Chart? A project planning tool that is used mostly by project managers. A Gantt chart is a graphical ...
| PowerPoint PPT presentation | free to view

A project planning tool that is used mostly by project managers. ... Used during the construction of the Hoover Dam and the Interstate Highway network ...
| PowerPoint PPT presentation | free to view

2006 Pearson/Prentice Hall. 3.1 Tracking Progress ... 2006 Pearson/Prentice Hall. 3.3 Effort Estimation. Watson and Felix Model Productivity Factors ...
| PowerPoint PPT presentation | free to download
Gantt Chart is the essential part of the project management. To achieve the success in project management, managers need to create action plan perfectly to impress the boss and stakeholder.
| PowerPoint PPT presentation | free to download

Originally used by BAE Systems on manufacture of BAE 146 and JetStream aircraft ... Problem Optimise sequencing of production operations for helicopter manufacture ...
| PowerPoint PPT presentation | free to view

IE 2030 Lecture 5: Project Management. Drawing Gantt Charts. Time on horizontal axis, ... IE 2030 Lecture 5: Gantt Charts. Gantt Chart Pros and Cons. Easy to ...
| PowerPoint PPT presentation | free to view
... start, constraints obtained by specifying predecessors, unless you KNOW you need ... DON'T put REPORTING tasks in the dependency chain, unless they are ...
| PowerPoint PPT presentation | free to download

Identify a named lead for the development of a prioritisation policy ... revise Lambeth Primary Care Trust business case template to promulgate ...
| PowerPoint PPT presentation | free to view

... Assessment. Resource Allocation. Trends Over Time. Purposes: ... Learning Outcomes Crosswalk. Outcome Indicators. Checkpoints. Data Sources. Banner Web Portal ...
| PowerPoint PPT presentation | free to view

This presentation educates you about Tableau - Bump Chart, Creating a Bump Chart in steps with chart example. For more topics stay tuned with Learnbay.
| PowerPoint PPT presentation | free to download

Title: Production Chart Author: acer Last modified by: Joybook S42 Created Date: 6/18/2005 2:56:04 AM Document presentation format: On-screen Show (4:3)
| PowerPoint PPT presentation | free to view
This presentation educates you about Tableau - Waterfall Charts and Creating a Waterfall Chart in step by step with example charts. For more topics stay tuned with Learnbay.
| PowerPoint PPT presentation | free to download

You may create a web-affiliated roadmap by using a chart or PowerPoint. There are special templates are around for this purpose. You can employ PowerPoint Roadmap Template Free which is a free template which can be easily downloaded from the internet and make your presentation.

Burn Down Chart Pepper Purpose When do I plan to finish? Am I on track to finish? Is every member of my team on track? Should I replan early? http://en.wikipedia.org ...
| PowerPoint PPT presentation | free to view

To keep you up to date on what employees are doing, you need a reliable web-based tool for building interactive organization charts software that conveniently converts data into charts. With Talygen, you can build your business charts in minutes.
| PowerPoint PPT presentation | free to download
The Stratada Timeline shows dates, milestones and progress based on OnePlan data. Understanding metrics around objectives is critical to decision making. The Stratada Timeline is used to show the timing of the objectives. This report shows a high level view of metrics around resources and effort. http://stratada.com/
| PowerPoint PPT presentation | free to download

The estimated time each task will take. The dependencies between those tasks. Sequence ... Success, failure or completion of the task can be easily ascertained ...
| PowerPoint PPT presentation | free to view

Store name, type, value of element. Voltage. Circuit Element. Shapes. Transmission Line ... File Help. R1=10kO. R2=100kO. RL=45kO. ???Comments are written like this ...
| PowerPoint PPT presentation | free to download

Electrics, plumbing and landscaping are concurrent tasks and can happen at the ... Step 8 Amend your diagram to show the critical path. 1. 1.1. 1. 1.2. 1.5 ...
| PowerPoint PPT presentation | free to view

Gantt vs. Network Based Approach. From the end of Chapter 5, complete Discussion Question 3: What are the main advantages of using a network-based approach to project management rather than a Gantt chart? Under what circumstances might a Gantt chart be preferable to a network-based approach? Respond to at least two of your classmates’ postings.
| PowerPoint PPT presentation | free to download

The gantt chart PowerPoint and Keynote template is used to prepare presentations that involve gantt charts. By using this template, one can make presentations to represent all the things needed to be done during the project with a deadline.

Need a free Gantt chart software, you re search ends here! Select from these best free Gantt chart software online options and make the right choice for your team

Develop a project schedule using PERT and Gantt charts ... Gantt Chart for Entire Project (with overlapping phases) 3 ... Gantt Chart for Iterative Project ...
| PowerPoint PPT presentation | free to download
Planning Charts and Diagrams: Small Kitchen Scale
| PowerPoint PPT presentation | free to download

www.spiderproject.ru * * * * * * * * * * * * Reports Spider Project Reports Spider Project graphical reports include: Activity Gantt Charts, Resource Gantt Charts ...
| PowerPoint PPT presentation | free to view

GANTT Chart. Normailzation. Yifeng. Clustering. Chunyan. Statistical. Analysis. Yifeng. Server Setup ... Microarray Pipeline: GANTT Chart ...
| PowerPoint PPT presentation | free to view

Gantt chart. Fish diagram. Job/Worksite Analysis Guide. IE 327. 5. PARETO ... GANTT CHART. Horizontal bar chart of activities. Shade in bar as completed ...
| PowerPoint PPT presentation | free to view

How can we update the website to make it more user friendly? ... And Survey. Scenario. And Survey. Kindergarten Teacher. First Grade Teacher. Webmaster ...
| PowerPoint PPT presentation | free to view

Team Organization Structure. Rotate team leader monthly. Every member will have a ... Gantt Chart. PERT Chart. Schedules - Gantt Chart. Schedules PERT Chart ...
| PowerPoint PPT presentation | free to view

6. Prepare Organisational Responsibility Chart. 27. BAR (GANTT) CHART. Developed by Henry L. Gantt. The horizontal axis shows the time. ...
| PowerPoint PPT presentation | free to view

Manajemen Waktu Proyek (lanj.) Gantt Chart Gant chart menyediakan format standar utk menampilkan informasi jadwal proyek dgn menampilkan aktivitas proyek beserta ...
| PowerPoint PPT presentation | free to download

i) Specify the Gantt Chart ( A chart depicting the allocation sequence of each ... GANTT Chart. P1. P3. P0. P2. P4. DiS. DiS. DiS. DiS ...
| PowerPoint PPT presentation | free to view
Map network to a timeline (eg Gantt Chart) using the effort estimates. ... Gantt Chart producers. MS Project. Web access. Supports multiple projects. Dependencies ...
| PowerPoint PPT presentation | free to download

Gantt Chart. Tabulate Project Tasks. Title and ID Number for Each Task ... Gantt Chart - Pros and Cons. Strengths. See Status of Each Task at Any Point in Time ...
| PowerPoint PPT presentation | free to view

... and Review Technique (PERT) ???????? ?????? ?????????? ... PERT ??????? ? CPM. ?????????? ?? ??????? ????????? ?-? ???????? ?????. Slide 20. Gantt Chart ...
| PowerPoint PPT presentation | free to view

Bottom-Up budgeting used. Novel project - lack of prior management experience to to Top-Down ... Critical Path Concept. Slack. Gantt Charts. Gantt Charts ...
| PowerPoint PPT presentation | free to view

Work Breakdown Structures Gantt Chart for Project X Gantt Chart for Software Launch Project Milestones Milestones are significant events on a project that normally ...
| PowerPoint PPT presentation | free to view