
Creating Interactive Infographics PowerPoint PPT Presentations
All Time
Recommended

Ever wondered why infographics and data visualization have become so popular in the last few years? With the increasing competition in businesses, people are looking at ideas that will help them save time and money and yet deliver the message.
| PowerPoint PPT presentation | free to download

Infographics in PDF are visual data representations that simplify complex ideas in a graphic format for better understanding and engagement. They can vary in size but are usually designed to fit a standard letter or A4 page. Infographics can be single-page or multi-page depending on the content, with digital versions tailored for online use and often featuring interactive elements. Pictures and visuals are commonly used in infographics to enhance the information presentation and make it visually appealing.
| PowerPoint PPT presentation | free to download

Infographics are visual artworks that combine images and text to share information. They can range from a single page to multiple pages, depending on the complexity of the data. While most infographics are static, some may include videos for better comprehension. Infographics can be simple or elaborate, with the design catering to the target audience and purpose. A successful infographic blends captivating visuals with clear and concise information, capturing the viewer's interest and effectively delivering the message.
| PowerPoint PPT presentation | free to download

To create an engaging infographic presentation in PowerPoint, start by brainstorming ideas and selecting relevant data. Use creative elements like unique colors, custom icons, and varied fonts to enhance visual appeal. Editing in PowerPoint is easy, allowing you to adjust shapes, text, and images to fit your design. Prioritize clarity and simplicity when presenting data; using charts or graphs can help highlight key points effectively. For timeline infographics, leverage PowerPoint's SmartArt features to create attractive timelines that showcase progress or events over time. By combining these techniques, you can develop an impactful infographic presentation that captures and retains your audience's attention.
| PowerPoint PPT presentation | free to download

This infographic showcases five creative and engaging ways to use custom plush toys for employee appreciation on Valentine's Day. It visually illustrates ideas for personalized plush pals, themed collections, interactive experiences, and unique gift packages. Discover how to go beyond traditional gifts and create a memorable and impactful Valentine's Day celebration for your team.
| PowerPoint PPT presentation | free to download

Infographics are a powerful tool for presenting complex information in a visually appealing way. They have a long history and are now a crucial part of modern communication. By combining text, images, and data, infographics create engaging narratives that help viewers understand and remember information easily. The main purpose of an infographic is to simplify data and convey important messages effectively. With their ability to captivate and inform, infographics are widely used across different platforms to share information efficiently.
| PowerPoint PPT presentation | free to download

Elevating your consulting decks with 10 creative data visualization ideas can differentiate your work and leave a lasting impression on clients. By incorporating innovative and visually engaging charts, graphs, and infographics, you can effectively convey complex information in a clear and concise manner.
| PowerPoint PPT presentation | free to download

Infographics are powerful tools that present information visually in an engaging and easy-to-understand way. They use vibrant colors, images, and data visualizations to capture viewers' attention and communicate messages effectively. To create a successful infographic, focus on clear and concise design that conveys the main message succinctly. The title should summarize the message, which should also be reinforced through visual elements.
| PowerPoint PPT presentation | free to download

Incorporating unique elements such as interactive charts, infographics, and animations can help capture the attention of your audience and make your message more memorable. Utilizing a clean and modern design aesthetic, along with incorporating your branding elements, can help establish credibility and professionalism.
| PowerPoint PPT presentation | free to download

Creating effective micro-learning modules involves condensing content into bite-sized, focused segments to maximize learner engagement and retention. Employing interactive elements, multimedia, and targeted assessments enhances effectiveness and reinforces key concepts efficiently.
| PowerPoint PPT presentation | free to download

An infographic serves as a visual aid crafted to convey intricate information in a straightforward and captivating manner. By integrating text, imagery, and graphics within a unified framework, it produces a visually stimulating and easily comprehensible depiction of data or ideas. Essential components of an infographic encompass visual hierarchy, color palette, typography, data visualization, content, and layout composition. Through the strategic use of charts, graphs, and symbols, an infographic effectively illustrates information to enhance understanding and retention. Ultimately, the primary objective of an infographic is to present information in a visually enticing and readily comprehensible format.
| PowerPoint PPT presentation | free to download

A beginner's guide to creating effective eLearning for compliance training outlines key steps for developing engaging and regulatory-compliant courses. Start by identifying regulatory requirements, learning objectives, and target audience needs to tailor content effectively. Utilize interactive elements, real-world scenarios, and assessments to reinforce understanding and promote compliance adherence among learners. https://www.kytewayelearning.com/article/creating-effective-elearning-for-compliance-training
| PowerPoint PPT presentation | free to download

To create engaging content for your website, understand your audience and their interests. Use a conversational tone, compelling visuals, and storytelling techniques to captivate readers. Keep content concise, relevant, and easy to understand. Incorporate multimedia elements like videos and infographics for variety. Encourage interaction through comments, polls, or quizzes. Regularly update content to keep it fresh and relevant to your audience's needs. To know more visit here https://singhimarketingsolutions.com/web-designing-services/faridabad/
| PowerPoint PPT presentation | free to download

In today’s digital age, crafting a viral campaign can be the golden ticket to making your brand stand out. With social media’s reach expanding every day, it’s easier than ever to create a buzz if you know the right approach. Whether you’re a small business owner, a digital marketer, or just someone looking to elevate your online presence, this guide will provide you with actionable social media marketing tips to help you create campaigns that not only catch attention but also drive results.
| PowerPoint PPT presentation | free to download

Looking for unique ways to celebrate Get to Know Your Customers Day? This infographic presents creative and visually engaging ideas for using custom plush toys to connect with your audience and build stronger relationships.
| PowerPoint PPT presentation | free to download

Infographics serve as powerful tools in presentations, transforming complex data into visually engaging formats that enhance audience comprehension. By distilling information into clear, concise visuals, infographics facilitate quicker understanding and retention, catering to diverse learning styles. They break down intricate concepts, making them accessible and relatable, thus fostering audience engagement.
| PowerPoint PPT presentation | free to download

Learn the essentials of crafting a successful digital marketing strategy with SMASH Interactive Agency. Our comprehensive guide is tailored for businesses in Palm Beach, offering expert insights and actionable steps to elevate your online presence. Discover why we are the go-to digital marketing agency in Palm Beach. For more details, visit us: https://smashinteractiveagency.com/seo-palm-beach.html info@smashtoday.com 786.899.2424
| PowerPoint PPT presentation | free to download

Interactive Content can attract new visitors and can provide the great conversion. Therefore brands consult a web design company in India to create amazing interactive content for them. Those who don't believe in the power of interactive content must go through the following stats.
| PowerPoint PPT presentation | free to download

In today's digital world, content marketing has evolved significantly, and interactive content has become an essential part of any digital marketing strategy. https://www.digitalpiloto.com/digital-marketing-agency-kolkata/
| PowerPoint PPT presentation | free to download
In today's world, how we share ideas is changing quickly because of technology. The tools we use to present information, like in schools and businesses, are getting better and more interesting. They're becoming more interactive, which means people can join in more. This helps keep the audience interested. Also, making presentations is becoming easier. Soon, we might even have presentations that feel like we're really there! These changes are all about making communication better and more enjoyable. Let's see what's next in presentation software and how it will make connecting with others even better.
| PowerPoint PPT presentation | free to download

This PPT explores effective strategies for creating a successful B2B lead generation campaign, including the importance of understanding your target audience, leveraging technology, and implementing best practices.
| PowerPoint PPT presentation | free to download
Creative logistics ads are essential for standing out in a competitive market. By combining visual appeal, clear messaging, and targeted content, businesses can create ads that not only capture attention but also build strong connections with their audience.
| PowerPoint PPT presentation | free to download

Infographics serve as visual aids that condense intricate information into easily comprehensible visuals. These versatile tools play a crucial role in SEO strategies, attracting valuable backlinks and driving website traffic through the presentation of data in a visually captivating manner. Infographic concepts span from data representation to instructional guides and comparative analyses. While infographics traditionally take the form of static images, the incorporation of animation can enhance user interaction.
| PowerPoint PPT presentation | free to download
Today, the current web space is filled with excessive content. Clients find it difficult to grasp such content on the go. Somehow, due to this reason, people end up making wrong decisions. Statistics is known to add credibility to the particular infographics. It enables break down of data that might have otherwise been very tiresome for an average reader. By employing animated infographics, data becomes educational and enjoyable to read
| PowerPoint PPT presentation | free to download

Positioning your Graphic Designing Company as an expert creative partner is crucial for standing out in a competitive market. It involves a strategic approach towards defining your unique identity, targeting the right audience, and delivering exceptional services that create an undeniable reputation. This guide will walk you through the essential steps to elevate your agency's positioning and become the go-to creative partner in your industry.
| PowerPoint PPT presentation | free to download
An affordable Facebook ads agency - This is what almost every business owner mentions first on their checklist while looking to hire a Facebook advertisement agency.
| PowerPoint PPT presentation | free to download

Since the last one year, many articles have popped up on the internet saying, “Infographics are dead.” That is not at all true! Infographics are very alive and doing well and in fact if anything, they have only grown more in demand.
| PowerPoint PPT presentation | free to download

If a person has a business plans and wanted to use festivals for better outcomes, then Diwali is the best option. This is because millions of people surf online for shopping; therefore, a properly structured digital marketing plan can help your brand gain visibility and sales.
| PowerPoint PPT presentation | free to download

Online Word Count tool using for complete analysis of your articles including grammatical errors, character count and reading level. You can make audience engage in blogs, eBooks, webinars, report, podcasts, infographics, etc. Focus on Trendy forms of content writing for promoting interactive content, it helps to boosting website ranking.
| PowerPoint PPT presentation | free to download

In fact, the best way to communicate should be right there in your email itself. For this reason, some kinds of interaction techniques work well, but others are mostly left for a different campaign. With interactive communication through using email, a business can gradually create a large customer base.
| PowerPoint PPT presentation | free to download

Creating a fun and safe environment at work is a top priority, and what better way to do that than with some entertaining safety videos? These videos inform employees and visitors of potential hazards and show them the proper procedures and emergency protocols. Let’s make sure everyone goes home safe and sound.
| PowerPoint PPT presentation | free to download
The WOW factor about top Interactive content Platform is active participation and personalization for customers. But why is this the right time to include it in your content strategy and how can you do it? People are attracted to your site when there is an effort in every little bit.
| PowerPoint PPT presentation | free to download
This ppt is informative for both academia and industry, all of our focus to posts presentation on the topic of Website design & development, Mobile Application, Salesforce CRM management and Appraisal Quality Control.
| PowerPoint PPT presentation | free to download

Create custom visuals for Power BI Visualize your data in many ways by creating fully-customized data visualizations.Browse and visit on loginworks.com/power-bi. https://www.loginworks.com/power-bi
| PowerPoint PPT presentation | free to download

Today, I am going to explain how to create Custom visualizations in Power BI. First, understand its meaning. As we all know that when you create a report in Power BI desktop, Power BI provides us a visualization pane which contains different types of visualizations like Bar chart, Line chart, Scatter & etc. https://www.loginworks.com/blogs/how-to-create-custom-visualizations-in-power-bi/
| PowerPoint PPT presentation | free to download

Content Marketing is a technique for creating and distributing relevant and valuable content for a brand's target audience, through which it seeks to retain and acquire new customers. Know more about the importance of content for seo at https://rankdigital.co.nz/seo/improve-your-seo-and-google-ranking-with-regular-blog-post-in-nz/
| PowerPoint PPT presentation | free to download

You may have observed breathtaking graphical visuals at a bus stand or perhaps came across a complex statistical graph? But, have you ever wondered how that is created? What kind of software were used? There are multiple dimensions to understand this subject.
| PowerPoint PPT presentation | free to download
Looking at the current demand of animated visuals that are being utilized for business presentations, analytical reports, and social media activities, it appears that the need for infographics has risen tremendously.
| PowerPoint PPT presentation | free to download

This Infographic - Find out the interesting tips that you should consider while carrying out portrait photography so that the outcome lives up to your expectation.
| PowerPoint PPT presentation | free to download

The following tips in custom course development are valuable for this purpose. Keep in mind, nonetheless, that these are general recommendations that require customisation to suit your unique case.
| PowerPoint PPT presentation | free to download
The 10 skills in demand around the required by every digital marketer should learn to get you hired in 2017.Agencies and companies are always looking for professional who have up to date skills.If you want to get ahead you should always be learning new skills . For more information about the skills please visit our website for Digital Marketing Course in Delhi.
| PowerPoint PPT presentation | free to download

An interactive education and research exhibit from Oregon Health & Science University
| PowerPoint PPT presentation | free to download

Discover the excellent and effective visual content marketing tips to which will help you to create the most engaging content! Know the Benefits of visual content in SEO and enhance your website's performance on the web.
| PowerPoint PPT presentation | free to download

Web Content is a key factor to get the ranking including website user experience and other factors. This presentation highlights about Beginner’s Guide to Creating Website Content. Presentation by www.aumcore.com.
| PowerPoint PPT presentation | free to download

Infographics are popular for their visual appeal and clear presentation of complex information. They are unique visual representations of data created with creativity and innovation. In education, infographics are used as tools to help students grasp information better. They differ from memes, which are humorous images or videos with text, as infographics focus on conveying information effectively. The theory behind infographics, known as infographic theory, includes principles and techniques for creating them, such as design elements, data visualization, and storytelling. Infographics are widely shared on social media and might include humor, but their main purpose is to convey information efficiently through visual means.
| PowerPoint PPT presentation | free to download

For a successful business on web you have to first create a position on SERP by getting large amount of traffic to your business page and obviously it will not come overnight.If you spend some time and pay attention, you can get through this maze.
| PowerPoint PPT presentation | free to download
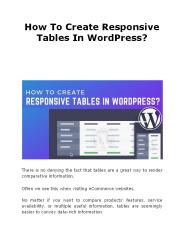
There is no denying the fact that tables are a great way to render comparative information. Often we see this when visiting eCommerce websites. No matter if you want to compare products’ features, service availability, or multiple useful information, tables are seemingly easier to convey data-rich information. Now you might be wondering when the same job can be done by a few chunks of text why one would need tables, right? Read more on https://bit.ly/2MZKtza
| PowerPoint PPT presentation | free to download
SAP Lumira is a powerful data visualization and business intelligence tool designed to help organizations transform raw data into meaningful insights. Through intuitive interfaces and advanced analytics, it enables users to create compelling dashboards, visualizations, and interactive reports that can be easily shared across teams.
| PowerPoint PPT presentation | free to download

Creating a good impression of your brand is essential for making a long-lasting relationship with your customers. One such way to ensure it is to have a website that is interactive and conveys the message of your brand clearly to the customers. Exnovation, our web design company in Sydney, will help create a captivating online presence for your business.
| PowerPoint PPT presentation | free to download

Power BI simplifies the way you showcase data by turning complex numbers into visually stunning and interactive stories. With its ability to merge data from multiple sources, real-time updates, and fully customizable designs, creating an infographic becomes effortless yet impactful. Imagine presenting key insights that are not only visually appealing but also easy for your audience to explore and understand. From tracking trends to displaying predictive insights, Power BI offers a smart and engaging way to convey your message clearly.
| PowerPoint PPT presentation | free to download

Graphic designers use software like Photoshop to create and edit images, making it an essential part of their work. They usually begin with a concept and sketches before moving to digital tools. Key programs include Photoshop, Illustrator, and InDesign, which help turn their ideas into actual designs. Common graphic images include logos, brochures, posters, and infographics, each serving different communication and branding purposes. There are seven main types of graphic design: visual identity, marketing and advertising, user interface, publication, packaging, motion graphics, and environmental design. This variety shows the wide range of skills and creativity involved in graphic design. By combining artistic talent with technical knowledge, graphic designers create appealing images that effectively communicate messages and engage audiences.
| PowerPoint PPT presentation | free to download

Social media design is important for brands to effectively communicate with their audiences and boost user engagement. To create impactful designs, one should understand key design principles like color theory, typography, and layout, which help grab attention and convey messages clearly. Social graphics, including images, videos, and infographics, play a vital role in building brand identity and storytelling on various platforms. Aspiring social media designers should focus on developing their skills with graphic design software and keep up with current trends. Creating a diverse portfolio of work is also essential for standing out in this competitive industry.
| PowerPoint PPT presentation | free to download

To create an engaging pitch deck, combine creativity, thoughtful design, and an understanding of your audience. Focus on storytelling to captivate your audience from the beginning. Use compelling visuals and infographics to enhance your message, as good design helps keep attention and shows professionalism. Follow key guidelines: keep s concise, use bullet points effectively, and maintain a consistent theme throughout the deck. Choose a strong title that reflects your main message, setting the tone for your presentation and inviting your audience to understand your vision. By integrating these elements, your pitch deck can become a powerful tool to communicate your ideas effectively and engage your audience.
| PowerPoint PPT presentation | free to download

To create engaging content for your website, understand your audience and their interests. Use a conversational tone, compelling visuals, and storytelling techniques to captivate readers. Keep content concise, relevant, and easy to understand. Incorporate multimedia elements like videos and infographics for variety. Encourage interaction through comments, polls, or quizzes. Regularly update content to keep it fresh and relevant to your audience's needs. To know more visit here https://singhimarketingsolutions.com/web-designing-services/gurugram/
| PowerPoint PPT presentation | free to download

Jane Ellen Stevens - The Power and Economics of Backpack Journalism ... Beat Shell www.cjonline.com/legislature. seattlepi.nwsource.com/transportation. Jonathan Dube ...
| PowerPoint PPT presentation | free to view