
SmartArt for Effective Timeline Infographics in PowerPoint - PowerPoint PPT Presentation
Title:
SmartArt for Effective Timeline Infographics in PowerPoint
Description:
To create an engaging infographic presentation in PowerPoint, start by brainstorming ideas and selecting relevant data. Use creative elements like unique colors, custom icons, and varied fonts to enhance visual appeal. Editing in PowerPoint is easy, allowing you to adjust shapes, text, and images to fit your design. Prioritize clarity and simplicity when presenting data; using charts or graphs can help highlight key points effectively. For timeline infographics, leverage PowerPoint's SmartArt features to create attractive timelines that showcase progress or events over time. By combining these techniques, you can develop an impactful infographic presentation that captures and retains your audience's attention. – PowerPoint PPT presentation
Number of Views:4
Date added: 23 January 2025
Slides: 3
Provided by:
visualsculptors
Category:
How To, Education & Training
Tags:
Title: SmartArt for Effective Timeline Infographics in PowerPoint
1
Data To Creative Infographic in PowerPoint Top
Questions Answered
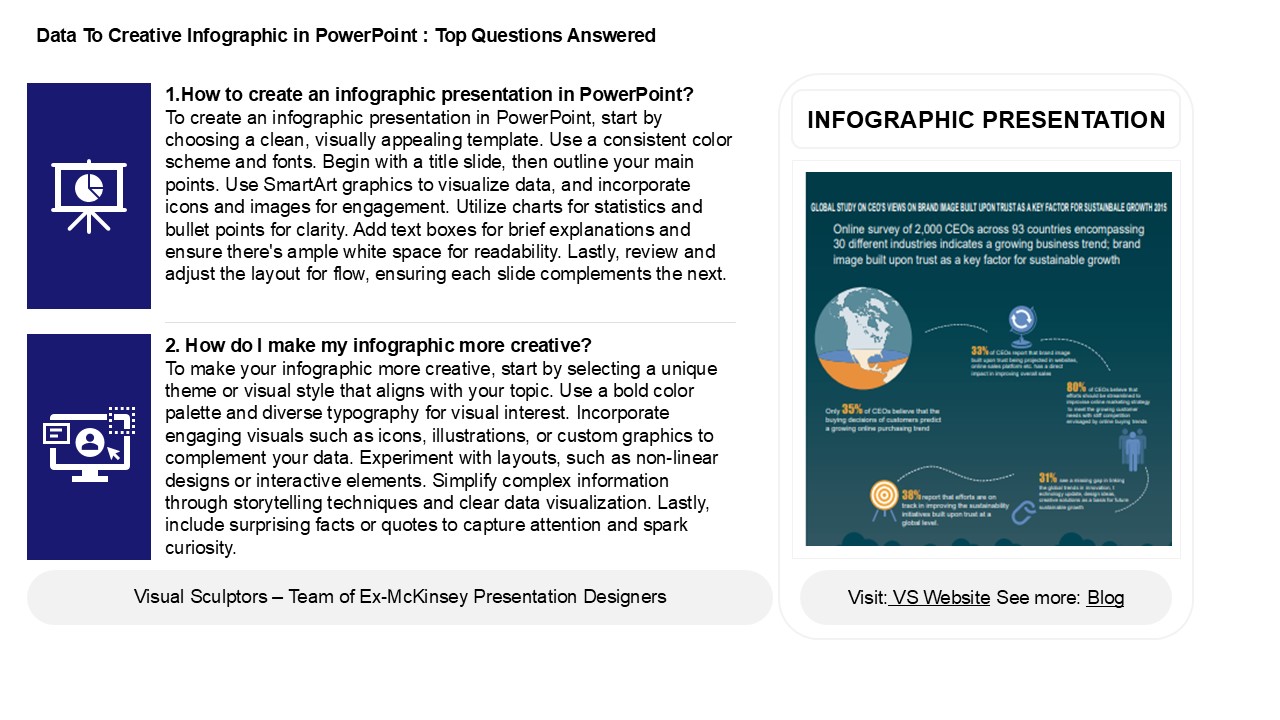
1.How to create an infographic presentation in
PowerPoint? To create an infographic
presentation in PowerPoint, start by choosing a
clean, visually appealing template. Use a
consistent color scheme and fonts. Begin with a
title slide, then outline your main points. Use
SmartArt graphics to visualize data, and
incorporate icons and images for engagement.
Utilize charts for statistics and bullet points
for clarity. Add text boxes for brief
explanations and ensure there's ample white space
for readability. Lastly, review and adjust the
layout for flow, ensuring each slide complements
the next.
INFOGRAPHIC PRESENTATION
2. How do I make my infographic more creative?
To make your infographic more creative, start by
selecting a unique theme or visual style that
aligns with your topic. Use a bold color palette
and diverse typography for visual interest.
Incorporate engaging visuals such as icons,
illustrations, or custom graphics to complement
your data. Experiment with layouts, such as
non-linear designs or interactive elements.
Simplify complex information through storytelling
techniques and clear data visualization. Lastly,
include surprising facts or quotes to capture
attention and spark curiosity.
2
Data To Creative Infographic in PowerPoint Top
Questions Answered
3. How do I edit an infographic in PowerPoint?
To edit an infographic in PowerPoint, first,
open the presentation containing the infographic.
Click on the infographic to select it. You can
then modify text by clicking on the text boxes
and typing your changes. For images, right-click
to replace or format them. Use the "Format" tab
to adjust colors, styles, and shapes. To move or
resize elements, click and drag or use the corner
handles. If the infographic is grouped,
right-click and select "Ungroup" to edit
individual components. Once done, save your
changes to retain the updated infographic.
4. How do you present data in an infographic? To
present data in an infographic, start by defining
your key message and target audience. Choose
relevant data and organize it logically. Use
visual elements like charts, graphs, icons, and
images to represent data clearly. Keep the design
simple and cohesive, using a consistent color
scheme and typography. Incorporate brief text
explanations to complement visuals. Ensure a
balanced layout for easy navigation, and include
sources for credibility. Finally, test the
infographic for clarity and impact before sharing
it across platforms.
5. How to create a timeline infographic in
PowerPoint? 1. Open PowerPoint and select a
blank slide. 2. Go to the "Insert" tab, click on
"SmartArt," and choose "Process" to find timeline
options. 3. Select a timeline layout, then click
"OK." 4. Add your milestones by clicking on the
text boxes within the SmartArt. 5. Customize
colors and styles using the "Design" tab. 6.
Insert icons or images for visual appeal by using
the "Insert" tab. 7. Adjust the layout and text
for clarity. 8. Save your work and export if
needed.
Recommended
CrystalGraphics Presentations


