
Organization Chart PowerPoint PPT Presentations
All Time
Recommended

Create organization chart and set-up your organization charts quickly by using the practical skills.
| PowerPoint PPT presentation | free to download
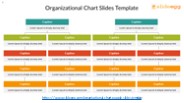
Optimize your organization's structure with SlideEgg's Organizational Chart PowerPoint Templates and Google Slides. These templates offer intuitive and visually appealing designs to represent your organization's hierarchy, departments, and roles effectively. Ideal for HR presentations, business proposals, or academic projects, they simplify complex structures and enhance clarity. Customize them effortlessly to fit your organization's needs and elevate your presentations. Explore SlideEgg's Organizational Chart Templates for a polished and professional representation of your organization's structure.
| PowerPoint PPT presentation | free to download

Organization Chart D:\data_d\Teaching Plan\lessonplan_website\MS_Powerpoint ...
| PowerPoint PPT presentation | free to download

Ribbon charts and stacked area charts differ in how they represent data visually. Ribbon charts show the ranking of categories over time, connecting points with ribbons to highlight changes in rank. In contrast, stacked area charts focus on the cumulative values of different categories, illustrating their contributions to a total over time. To create a proportional area chart in Excel, select your data, choose the "Area" chart option, and customize it for proportional sizes. You can smooth the area graph's appearance using the "Format Data Series" option. Area charts are useful for visualizing trends and comparing the relative proportions of categories, making them effective for data analysis and presentation. They help viewers quickly understand changes and comparisons, simplifying complex data for better comprehension.
| PowerPoint PPT presentation | free to download
satta matka, matka panel chart, satta matka jodi chart, dpboss, dpboss matka, kalyan matka, kalyan result, dp kalyan, dpboss live result, sridevi jodi chart, milan day, madhur day, kalyan night
| PowerPoint PPT presentation | free to download

To keep you up to date on what employees are doing, you need a reliable web-based tool for building interactive organization charts software that conveniently converts data into charts. With Talygen, you can build your business charts in minutes.
| PowerPoint PPT presentation | free to download

Would you like to create an organization chart but Don't Know how? Don't worry this file will help you with simple and easy steps. You can easily create an organizational chart by following this steps.
| PowerPoint PPT presentation | free to download

Steering Committee Sponsor Senior Mgmt Program Manager Project Manager Business Team Other Other Other Other Click on a box to modify Project Organization Chart *
| PowerPoint PPT presentation | free to download
In this video you can easily learn the Step-by-step tutorial on "How To Create An Organizational Chart In PowerPoint". Check out the following link to find the best "Tips & Tricks" in format. Visit Here: https://www.egg.com/how-to-create-an-organizational-chart
| PowerPoint PPT presentation | free to download

When: This document will be created during the Initiating Process and refined in ... Delete this note prior to publishing) Project Organization Chart. Click on ...
| PowerPoint PPT presentation | free to download

Dirt Bikes USA Organization Chart Author: Jane Laudon Last modified by: ... Times New Roman Default Design MS Organization Chart 2.0 Dirt Bikes USA Organization ...
| PowerPoint PPT presentation | free to download

The first chart, labeled 'Organization Next Steps' is the organization as it has ... Jewish. Islam. Hindu. Buddhist. Sikh. Bahai. Unitarian Universalist ...
| PowerPoint PPT presentation | free to view

Chair Benno Ritter. Marketing Organization Chart. Marketing Work Group Vice-Chair. Ryan Maley ... Chair. Martin Turon. ZigBee Architecture Review Committee (ZARC) ...
| PowerPoint PPT presentation | free to view

Click the organization chart and then use the tools on ... TO CREATE YOUR OWN CHART: On the Insert menu, point to Picture, and then click Organization Chart. ...
| PowerPoint PPT presentation | free to view

LES Corporate Organization Chart (Charlotte) Herb Gray CEO Houston Mc Gowan COO Venus Allen Corporate Compliance Dir. Z.A. Davis, MACC, MSW, LCSW Clinical Director
| PowerPoint PPT presentation | free to view

"Link Here : https://centongdawet.blogspot.com/?book=B08MSFDQV7 +++++++++++++++++++++++++++++ Made in USA• 200 blank face chart sheets for 100 different makeup styles, 2 faces per makeup, one with open eyes and one with closed eyes• Large oval face shapes, full page size, for detailed makeup design• 8.5 x 11 inch matte cover• Great quality paperback notebook• Wonderful gift for makeup lovers "
| PowerPoint PPT presentation | free to download

California State Student Association. California State Student Association Organization Chart ... California State Student Association Organization Chart ...
| PowerPoint PPT presentation | free to view

Do you want to create a beautiful and awesome your company organization chart on your WordPress website? We will help you create an organization chart in WordPress and tell you a few easy ways. Org charts are very useful in displaying company hierarchy and present users to the running the business. Please visit the following link to know the complete information: - https://www.wpglobalsupport.com/create-company-organization-chart-in-wordpress/
| PowerPoint PPT presentation | free to download

[Org Chart Title] Creating an Organization Chart. Hints: To create an organization chart, you can modify the example on this , or ...
| PowerPoint PPT presentation | free to download

FOR MORE CLASSES VISIT www.tutorialoutlet.com See the organization chart Bertas_and_HiFives_organization_charts Add content to the WBS created in Week 4. Use Microsoft Project to add dependencies, between tasks to the WBS for the BMOS project. The following video might be helpful for adding dependencies Add durations to each task. The entire project should span six months. Make sure that in the Task Mode column, the mode for each task is “Auto Scheduled.” All dates should automatically populate according to the project start date and task dependencies. Verify that durations make sense. Task durations may be changed by adding or removing days in the “Duration” column.
| PowerPoint PPT presentation | free to download

We empower businesses to seamlessly visualize their workforce and make more informed decisions. For more information about Organization Chart Builder visit http://talygen.com/organization-chart-builder.
| PowerPoint PPT presentation | free to download

World Health Organization International Growth Standards/Growth Charts Seven Minute Overview World Health Organization Growth Standards/ Growth Charts For this ...
| PowerPoint PPT presentation | free to view

And people can see. about two levels 'out' Digital Org Chart ... But of six-and-a-half billion individuals. Networking is the new freedom. the new democracy ...
| PowerPoint PPT presentation | free to view

Structure and Function of Living Systems Directions: Draw the following chart NEATLY in your journal using the entire page. Cut out the eight diagrams and glue them ...
| PowerPoint PPT presentation | free to download

ORGANIZATION CHART Organization is structed based upon eropean system ---french system. In this system, the Maitre d hotel is in charge of the dining rooms ...
| PowerPoint PPT presentation | free to download

To create an XY scatter chart in Excel, start by selecting your two numerical data sets and go to the "Insert" tab to choose the scatter chart option. You can enhance the chart by changing the bubble sizes in the scatter plot by selecting the data series and adjusting the size properties. Remember, scatter charts show the relationship between two variables, while line charts display trends over time. If you're using a bubble chart, you can add labels through the "Data Labels" feature in the chart tools. The main difference between bubble charts and scatter plots is that bubble charts also represent a third variable through the size of the bubbles, whereas scatter plots focus only on the correlation between the two main variables shown on the axes.
| PowerPoint PPT presentation | free to download

Unlike Functional Manager, PM is More ... 2_Blends MS Organization Chart 2.0 Project ... Styles that Work Organizational Problems Organizational Approaches ...
| PowerPoint PPT presentation | free to download

FOR MORE CLASSES VISIT tutorialoutletdotcom Operations Chart Directions: Complete the Operations Chart, based upon the strategic plan you have established for your organization. Write your strategic initiative in the space provided and write three to five primary goals.
| PowerPoint PPT presentation | free to download

Org Chart Software is the most Versatile, Automated, Multi Functional and Efficient software for creating organizational charts, reports and directories in minutes. Take the product tour to know more about the Org Chart Software.
| PowerPoint PPT presentation | free to download

For more course tutorials visit www.tutorialrank.com Reference Chart Instructions: Create a chart detailing the three different forms of business organizations (proprietorships, partnerships, and corporations). Also
| PowerPoint PPT presentation | free to download

FOR MORE CLASSES VISIT www.hcs380rank.com Reference Chart Instructions: Create a chart detailing the three different forms of business organizations (proprietorships, partnerships, and corporations). Also
| PowerPoint PPT presentation | free to download

A stock chart in PowerPoint effectively illustrates a stock's historical performance, capturing key price points such as opening, closing, high, and low values over time. To construct a radar chart, begin by organizing your data into a table, enabling a comparative analysis across various categories. Known as spider or web charts, radar charts are designed to represent multiple variables and their interrelations. To customize the appearance of a radar chart, select the chart, navigate to the Chart Tools, and modify the fill settings as desired. For visualizing hierarchical data and relationships, a tree map is an ideal choice; simply select your data, access the Insert tab, and opt for Tree Map under the hierarchy chart options. Each of these chart types enhances the clarity and engagement of presentations by visually conveying intricate data, thereby facilitating a better understanding for the audience.
| PowerPoint PPT presentation | free to download

Pedigree Charts The family tree of genetics 4. Transgenic Organism: trans = across genic = race Contains genes from another organism Bacteria Virus Human 5.
| PowerPoint PPT presentation | free to view
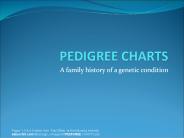
A family history of a genetic condition Pages 1-3 & 6-9 taken from Paul Billiet at the following website: saburchill.com/IBbiology/.../images/05PEDIGREE CHARTS.ppt
| PowerPoint PPT presentation | free to download
Structure Charts Agenda: Use of Structure Charts Symbols How to create Structure Chart Use Describe functions and sub-functions of each part of system (in more detail ...
| PowerPoint PPT presentation | free to download
Delhi Bazar Satta Chart offers insights into market trends and outcomes without promoting game. It provides valuable data for informed decision-making without engaging in satta activities. Visit Us: https://delhi-king.com/charts/delhi-bazar/2024
| PowerPoint PPT presentation | free to download

A butterfly chart serves as a powerful data visualization instrument, enabling the side-by-side comparison of two distinct datasets while effectively highlighting their differences or similarities. To construct a butterfly chart in PowerPoint, one begins by arranging a bar or column chart that positions the datasets on either side of a central axis. This process entails selecting the appropriate data, inserting the chart, and tailoring its design to achieve the desired butterfly configuration. This chart format is particularly advantageous for depicting distributions, such as demographic statistics, thereby facilitating a clearer understanding of comparative data for the audience. In tabular presentations, butterfly charts significantly improve clarity and support rapid analysis, making them indispensable for a range of applications, including business presentations and academic research.
| PowerPoint PPT presentation | free to download

For more classes visit www.snaptutorial.com HTT 250 Week 1 Assignment Organization Chart Hotel Front Office HTT 250 Week 1 CheckPoint Total Quality Management
| PowerPoint PPT presentation | free to download

A Mekko chart, or Marimekko chart, is a visual tool for displaying categorical data in two dimensions, useful for analyzing market share, revenue distribution, and other comparisons. To create a Mekko chart, you first need to organize your data into categories and dimensions, then use software like Excel or specialized charting programs to visualize it. Editing the chart is easy; you can adjust data series, change colors, or resize segments for better clarity. Adding a title is straightforward—just click the title area and type your text. Unlike standard bar charts, which have uniform bar widths, Mekko charts use variable widths to represent the size of each category, providing a more detailed view of the data. This makes Mekko charts a powerful option for visualizing complex data relationships.
| PowerPoint PPT presentation | free to download

Team Organization Structure. Rotate team leader monthly. Every member will have a ... Gantt Chart. PERT Chart. Schedules - Gantt Chart. Schedules PERT Chart ...
| PowerPoint PPT presentation | free to view

ORGANIZATION MANAGEMENT Organizational Design McKinsey 7-S Model Strategy Structure Systems Style Staff Skills Superordinate goals McKinsey 7-S Model Strategy ...
| PowerPoint PPT presentation | free to view

To create a clustered chart, like a clustered bar or column chart, start by organizing your data for easy comparison across categories. These charts are helpful for showing multiple series side by side, allowing you to easily see differences and trends. Clustered charts are widely used in business and research to illustrate relationships between multiple datasets. They are also known as grouped bar charts, highlighting their function of grouping related data for more effective analysis.
| PowerPoint PPT presentation | free to download

Organizing graphs in PowerPoint improves your presentation's clarity and effectiveness. Use a grid layout to align graphs with your content flow, ensuring they relate logically to your text. To create a map chart, utilize PowerPoint's built-in Map Chart feature to visualize geographical data. You can insert a world map by going to the "Insert" tab, selecting "Maps," and choosing a template. For specific maps, like building layouts, use the "Shapes" tool to draw and label areas. Additionally, consider drafting your layout in Word first, as it allows for better structure and easier adjustments before transferring to PowerPoint. By following these steps, you can create engaging and informative maps and graphs that enhance your presentations.
| PowerPoint PPT presentation | free to download

Using seating chart software, collaborate and organize all aspects of an occasion including guest list, floorplans, seating charts, and timelines quickly and efficiently. Seating Chart Software provide users a modern-day way of designing floorplan layouts and seating arrangements with just a click of a button.
| PowerPoint PPT presentation | free to download

For more classes visit www.snaptutorial.com Reference Chart Instructions: Create a chart detailing the three different forms of business organizations (proprietorships, partnerships, and corporations). Also include key users of financial information and briefly explain their roles. Cite 3 peer-reviewed, scholarly, or similar references to support your paper. Click on the Assignment Files tab to submit your assignment.
| PowerPoint PPT presentation | free to download

Sachiya Steel International is one of the efficient organizations in developing an exclusive range of Jindal ss pipe weight chart that can withstand high temperature and pressure. Sachiya Steel International is One Of the largest independent Stockholder of schedule 80 stainless steel pipe Weight, Stainless steel pipe Weight schedule 10 those are used in various industrial applications.
| PowerPoint PPT presentation | free to download

Pedigree Charts The family tree of genetics 4. Transgenic Organism: trans = across genic = race Contains genes from another organism Bacteria Virus Human 5.
| PowerPoint PPT presentation | free to view

To edit a column chart in PowerPoint, start by selecting the chart and using the Chart Tools on the ribbon to customize its design, layout, and format. For animations, go to the Animations tab to choose various effects that enhance how your data is displayed. In Google Slides, the process is similar; just insert a chart from the 'Insert' menu. A column chart uses vertical bars to clearly show and compare values across categories. If you need to sort the data in your column chart, you can do this in Excel or PowerPoint, and the chart will automatically update to reflect the new order. This ensures that your information remains organized and easy to understand.
| PowerPoint PPT presentation | free to download

Elevate your PowerPoint presentations by incorporating visual aids such as tree charts, decision trees, and sunburst charts. To create a tree chart, navigate to the "Insert" tab, select "SmartArt," and opt for a hierarchical layout. For a decision tree, follow a similar approach but choose a design that illustrates branching options. Utilize the "Shapes" tool to draw connecting lines between the various elements to clarify relationships. When designing a sunburst chart, choose the "Hierarchy" option in SmartArt to represent data in concentric circles effectively. To produce a starburst effect, combine various shapes and text boxes, arranging them to form a star-like structure that clearly communicates your message. These visual tools are instrumental in distilling complex information and enhancing comprehension for your audience.
| PowerPoint PPT presentation | free to download

Pedigree Charts The family tree of genetics 4. Transgenic Organism: trans = across genic = race Contains genes from another organism Bacteria Virus Human 5.
| PowerPoint PPT presentation | free to view

For more classes visit www.snaptutorial.com PM 582 Week 1 Leadership Styles & Diverse Teams (1150 Words) PM 582 Week 2 Team Assignment Work Breakdown Structure Sales Increase and Hiring Initiative (1400 Words) PM 582 Week 3 Team Project Organizational Chart Paper (2000 words) PM 582 Week 4 Communications Plan Matrix (2000 words)
| PowerPoint PPT presentation | free to download

Learn about the Baby Vaccination Chart by The ParentZ, which provides essential information on immunization schedules and benefits. This presentation equips parents with the knowledge needed to ensure timely vaccinations, protecting their children from preventable diseases and promoting overall health.
| PowerPoint PPT presentation | free to view

Excel Charts Basic Skills Creating Charts in Excel Creating a Run Chart Tracking Trends Creating a Column Chart Comparing Values Creating a Pie Chart Creating a ...
| PowerPoint PPT presentation | free to view

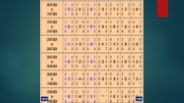
The Kalyan Panel Chart is a key element in the world of Satta Matka, offering players a way to engage with the game more strategically. Understanding how to read and analyze this chart can enhance one’s chances of making successful bets, though it is essential to remember the inherent risks associated with gambling. Whether you’re a seasoned player or a newcomer to Satta Matka, the Kalyan Panel Chart is a resource worth exploring for its potential insights into the game.
| PowerPoint PPT presentation | free to download

Gantt charts are essential tools for managing projects, and think-cell makes it easy to create and adjust them. To start, you can insert a Gantt chart directly from the think-cell toolbar, which helps visualize your project's timeline. Modifying the chart is simple; you can change task start and end dates by dragging the bar edges or entering new dates in the data sheet. Gantt charts are commonly used for software development projects, illustrating phases like planning, design, development, and testing. They can serve various purposes, such as scheduling tasks, tracking project progress, and improving team communication. By using think-cell's user-friendly features, you can improve your project management approach and ensure your timelines are clear and actionable.
| PowerPoint PPT presentation | free to download

Creating a 100% stacked bar chart in Excel is a straightforward process that effectively visualizes proportional data. Begin by organizing your data in a clear format, with categories in rows and series in columns. Highlight the data range, then navigate to the "Insert" tab on the ribbon. Select "Bar Chart," choosing the 100% Stacked Bar option from the dropdown menu. Once the chart appears, customize it by adding chart titles, data labels, and adjusting colors for clarity. Finally, review the formatting to ensure readability and professionalism, allowing stakeholders to easily interpret the proportional contributions of each category within the total.
| PowerPoint PPT presentation | free to download