
NASA Energy and Water cycle Study Road Map - PowerPoint PPT Presentation
1 / 1
Title:
NASA Energy and Water cycle Study Road Map
Description:
NASA Energy and Water cycle Study Road Map. Earth Science Enterprise. Systematic observations of water and energy cycle including national and international partners ... – PowerPoint PPT presentation
Number of Views:57
Avg rating:3.0/5.0
Title: NASA Energy and Water cycle Study Road Map
1
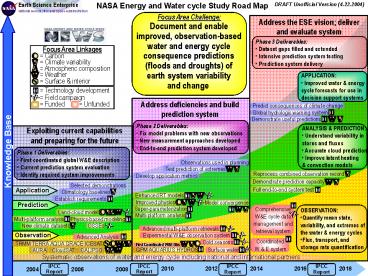
NASA Energy and Water cycle Study Road Map
DRAFT Unofficial Version (4.22.2004)
Earth Science Enterprise
National Aeronautics and Space Administration
Focus Area Challenge Document and enable
improved, observation-based water and energy
cycle consequence predictions (floods and
droughts) of earth system variability and
change
Address the ESE vision deliver and evaluate
system
- Phase 3 Deliverables
- Dataset gaps filled and extended
- Intensive prediction system testing
- Prediction system delivery
Focus Area Linkages
Carbon
C
Climate variability
V
Atmospheric composition
A
Weather
W
- APPLICATION
- Improved water energy
- cycle forecasts for use in
- decision support systems
Surface interior
S
Technology development
T
Field campaign
Address deficiencies and build prediction system
Funded
Unfunded
Predict consequences of climate change
Global hydrologic warning system
Demonstrate useful predictions
- Phase 2 Deliverables
- Fix model problems with new observations
- New measurement approaches developed
- End-to-end prediction system developed
Exploiting current capabilities and preparing for
the future
- ANALYSIS PREDICTION
- Understand variability in
- stores and fluxes
- Accurate cloud prediction
- Improve latent heating
- convection models
Knowledge Base
- Phase 1 Deliverables
- First coordinated global WE description
- Current prediction system evaluation
- Identify required system improvements
Observations used in planning
Test prediction of extremes
Reprocess combined observation record
Develop application metrics
Demonstrate prediction capacity
Selected demonstrations
Application
Full end-to-end system test
Climatology baselines
Enhanced RT models
Establish requirements
Improved physics
Model convergence
Prediction
- OBSERVATION
- Quantify mean state,
- variability, and extremes of
- the water energy cycles
- Flux, transport, and
- storage rate quantification
Comprehensive WE cycle data management
and retrieval system
Super-parameterization
Land-cloud model
Multi-platform analysis
Multi-platform analysis
Physics-based modeling
OSSEs
New climate datasets
Advanced multi-platform retrievals
Observation
Experimental WE observation system
Advanced Analysis
Coordinated W E system
Cold seasons
TRMM TERRA AQUA GRACE ICESAT
First Coordinated WE Obs
GPM AQUARIUS HYDROS
Surface water
CloudSAT
CALIPSO
AURA
Systematic observations of water and energy cycle
including national and international partners
IPCC Report
IPCC Report
IPCC Report
IPCC Report
2012
2014
2016
2018
2010
2004
2006
2008
Recommended
CrystalGraphics Presentations


