
Quality and Productivity Improvement - PowerPoint PPT Presentation
1 / 11
Title:
Quality and Productivity Improvement
Description:
Month Lost Departure Mechanical Overbooked Other. Luggage Delay. January 1 2 3 3 1 ... Late or unavailable cockpit crews. Late or unavailable cabin crews ... – PowerPoint PPT presentation
Number of Views:34
Avg rating:3.0/5.0
Title: Quality and Productivity Improvement
1
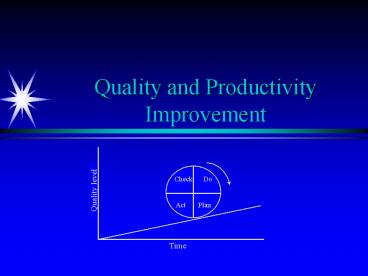
Quality and Productivity Improvement
Check Do Act Plan
Quality level
Time
2
Quality Tools
- Check Sheet
- Run Chart
- Histogram
- Pareto Chart
- Flowchart
- Cause-and-Effect Diagram
- Scatter Diagram
- Control Chart
3
Check Sheet
- Month Lost Departure
Mechanical Overbooked Other - Luggage Delay
- January 1 2 3 3 1
- February 3 3 0 1 0
- March 2 5 3 2 3
- April 5 4 4 0 2
- May 4 7 2 3 0
- June 3 8 1 1 1
- July 6 6 3 0 2
- August 7 9 0 3 0
- September 4 7 3 0 2
- October 3 11 2 3 0
- November 2 10 1 0 0
- December 4 12 2 0 1
- Total 44 84 24 16 12
4
Run Chart
5
Histrogram of Lost Luggage
6
Cause-and-Effect Chart for Flight Departure Delay
(Fishbone Chart)
Equipment
Personnel
Gate agents cannot process passengers quickly
enough
Too few agents
Aircraft late to gate
Agents undertrained
Late arrival
Agents undermotivated
Gate occupied
Agents arrive at gate late
Other
Mechanical failures
Late cabin cleaners
Late pushback tug
Weather
Late or unavailable cabin crews
Air traffic
Late or unavailable cockpit crews
Delayed Flight Departure
Poor announcement of departures
Weight an balance sheet late
Delayed checkin procedure
Late baggage to aircraft
Confused seat selection
Late fuel
Passengers bypass checkin counter
Late food service
Checking oversize baggage
Issuance of boarding pass
Acceptance of late passengers
Cutoff too close to departure time
Desire to protect late passengers
Material
Desire to help companys income
Poor gate locations
Procedure
7
Pareto Analysis of Flight Departure Delay Causes
8
Flowchart
9
Scatter Diagram
10
Control Chart of Departure Delays
expected
Lower Control Limit
1998
1999
11
Corporate Programs for Quality Improvement
- Marriott Personnel Programs
- Zero Defects (Crosby)
- Demings 14 Point Program
- Malcolm Baldrige Quality Award
- ISO 9000
- Benchmarking
Recommended
CrystalGraphics Presentations


