
Effects of the 2006 El Ni - PowerPoint PPT Presentation
1 / 1
Title:
Effects of the 2006 El Ni
Description:
2NASA Goddard Space Flight Center, Greenbelt, MD, USA. Contact: Jerald.R.Ziemke_at_nasa.gov ... from south east Asia in the north to western Australia in the south. ... – PowerPoint PPT presentation
Number of Views:22
Avg rating:3.0/5.0
Title: Effects of the 2006 El Ni
1
Effects of the 2006 El Niño on tropospheric ozone
and carbon monoxide Implications for dynamics
and biomass burning S. Chandra1,2, J. R.
Ziemke1,2, B. N. Duncan1,2, and T. N. Diehl1,2
1Goddard Earth Sciences and Technology,
Univ. of Maryland Balt. Co., Baltimore, MD, USA
2NASA Goddard Space Flight Center,
Greenbelt, MD, USA
Contact Jerald.R.Ziemke_at_nasa.gov
Abstract
observed characteristics of O3 and H2O inferred
from previous El Niño events. The changes during
the 2004 El Niño in tropospheric O3 and H2O from
TES are similar to those inferred from the Ozone
Monitoring Instrument (OMI) and Microwave Limb
Spectrometer (MLS) flown on the same Aura
satellite Chandra et al., 2007. The El Niño
related changes in tropospheric O3 in 2006 are
discernible in Figures 1a and 1b. These figures
show differences in OMI/MLS O3 (top panels) and
GMI O3 (bottom panels) between the years of 2006
(El Niño year) and 2005 (non-El Niño year).
During El Niño years the eastward shift in warm
sea surface temperature (SST) produces planetary
scale change in tropical convection which reduces
O3 in the eastern Pacific and increases O3 in the
western Pacific. Figure 1a for both model and
OMI/MLS shows largest increases of O3 over
Indonesia which will be shown later from the GMI
model to be caused in part by biomass burning.
Figure 1b for December shows that the patterns
for model and observations are also well in
agreement, but very different than for October.
Most of the changes for December including the
large depression of O3 over eastern Africa are of
dynamical origin. The GMI model indicates that
the reduced O3 over eastern Africa comes from
changes in O3 induced by changes in transport
affecting O3 in the upper troposphere. Most
changes in Figures 1a and 1b in the model are
primarily evenly balanced between upper
troposphere (above 500 hPa) and lower troposphere
(below 500 hPa).
We have studied the effects of the 2006 El Niño
on tropospheric O3 and CO at tropical and
sub-tropical latitudes measured from the OMI and
MLS instruments on the Aura satellite. The 2006
El Niño induced a severe drought which caused
large-scale fires (set to clear land) to burn out
of control during October and November months in
the Indonesian region. The effects of these
fires are clearly seen in the enhancement of CO
concentration measured from the MLS instrument.
We have used a global model of atmospheric
chemistry and transport (GMI CTM) to quantify the
relative importance of biomass burning and
transport in producing observed changes in
tropospheric O3 and CO. The model results show
that during October and November months both
biomass burning and meteorological changes
contributed almost equally to the observed
increase in tropospheric O3 over Indonesia. The
biomass component was 4-6 DU but it was limited
to the Indonesian region where the fires were
most intense. The dynamical component was 4-8
Dobson Units (DU) but it covered a much larger
area in the Indian Ocean and western Pacific
extending from south east Asia in the north to
western Australia in the south. By December 2006
the effect of biomass burning was reduced to zero
and the observed changes in tropospheric O3 were
mostly due to dynamical effects.
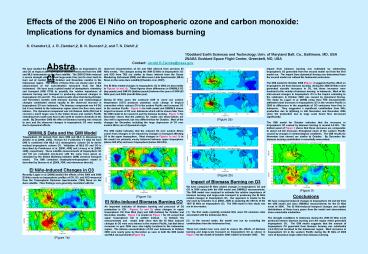
impact from biomass burning was estimated by
subtracting tropospheric O3 generated from the
second model run from the first model run. The
impact from dynamical forcing was determined from
the second model run without the Indonesian
emissions. The GMI model for October 2008
(Figure 3) suggests that the effect on
tropospheric O3 from biomass burning during the
2006 El Niño event generated sizeable increases
in O3, but these increases were localized to the
vicinity of biomass burning in Indonesia. Most
of the inter-annual changes in tropospheric O3 in
the tropics extending to the subtropics in
October 2006 was caused by dynamical forcing.
The study by Logan et al. 2008 using Aura TES
measurements attributed most increases in
tropospheric O3 in the western Pacific in 2006 to
differences in the magnitude of CO emissions from
fires in Indonesia. They suggested a significant
contribution from NOx production due to lightning
in late November and December 2006 when CO
production due to large scale forest fires
decreased significantly. The GMI model for
October indicates that the increases in
tropospheric O3 caused by biomass burning is
around 4-6 DU. The bottom panel of Figure 3
shows that these increases are comparable to
about 4-8 DU increases throughout much of the
western Pacific caused by changes in
meteorological conditions. The GMI results for
November (not shown) are similar to October. By
December the biomass burning contribution is
essentially nonexistent.
(Figure 2a)
OMI/MLS Data and the GMI Model
Tropospheric O3 derived from Aura OMI and MLS is
discussed by Ziemke et al. 2006, JGR. Version
8.5 (collection 3) total O3 from OMI is
combined with MLS v2.2 stratospheric column O3 to
derive residual tropospheric column O3.
Validation of MLS O3 and CO is described by
Froidevaux et al. 2008, JGR and Livesey et al.
2008, JGR, respectively. These satellite
measurements of tropospheric O3 and CO are
evaluated one-to-one with the same trace gases as
simulated by the Global Modeling Initiative (GMI)
chemical transport model. The GMI combined
stratosphere-troposphere model is described by
Duncan et al. 2008, JGR, and references therein.
Conclusions
El Niño-Induced Changes in O3
(Figure 2b)
Recently Logan et al. 2008 studied the effects
of the 2004 and 2006 El Niño events on
tropospheric profiles of CO, O3, and H2O measured
from the Tropospheric Emission Spectrometer (TES)
flown on the Aura satellite. Their findings were
generally consistent with the
Impact of Biomass Burning on O3
We have compared El Niño related changes in
tropospheric O3 and CO in 2006 using both the GMI
model and OMI/MLS measurements. The GMI model
was analyzed to estimate the relative importance
of biomass burning and large-scale transport in
producing the El Niño related changes in
tropospheric O3. Our approach is similar to the
one used by Chandra et al. 2002, JGR in
analyzing the effects of the 1997 El Niño on
tropospheric O3. The GMI model in this study was
run in two modes (1) The first mode
explicitly included NOx aned CO emission rates
associated with the Indonesian fires. (2) In
the second mode, the model was run by excluding
the contributions from the Indonesian
fires. These two model runs were used to assess
the effects of biomass burning and large-scale
transport on tropospheric O3 as shown in Figure 3
for the month of October 2006 relative to October
2005. The
(Figure 3)
Conclusions
(Figure 1b)
El Niño-Induced Biomass Burning CO
We have compared induced changes in tropospheric
O3 and CO from the GMI model and Aura OMI/MLS
measurements for the El Niño event of 2006. The
El Niño-induced temporal changes and spatial
distributions of these trace gases from the model
and observations show remarkable
similarities. The drought conditions in
Indonesia during the 2006 El Niño event produced
intense biomass burning over the region which
generated tropospheric O3. The GMI model
suggests that the amount of tropospheric O3
generated from biomass burning was substantial
(4-6 DU) but localized to the Indonesian region.
Most increases in tropospheric O3 in the western
Pacific during the El Niño of 2006 were of
dynamical origin rather than biomass burning.
An important indicator of biomass burning and
precursor of O3 production is CO. Figures 2a and
2b show changes in upper tropospheric CO from MLS
(top) and GMI (bottom) for October and December
months. Figure 2 is similar to Figure 1 for O3
except that upper tropospheric CO is plotted
instead. In October the measurements and model
both show that the El Niño induced changes in CO
were very intense in the western Pacific, but
that these increases in year 2006 were also
highly localized to the Indonesian region. The
intense concentrations of CO over Indonesia in
October 2006 were nearly gone by December as seen
in both the GMI model and MLS measurements
(Figure 2b).
(Figure 1a)
Recommended
CrystalGraphics Presentations


