
Shadow Tracking Demo - PowerPoint PPT Presentation
1 / 4
Title:
Shadow Tracking Demo
Description:
Black dots represent a mote's detection of a shadow passing over its sensor. ... RFM 918 MHz radio, in OOK mode, 19200 baud. Transmit power control for variable range ... – PowerPoint PPT presentation
Number of Views:46
Avg rating:3.0/5.0
Title: Shadow Tracking Demo
1
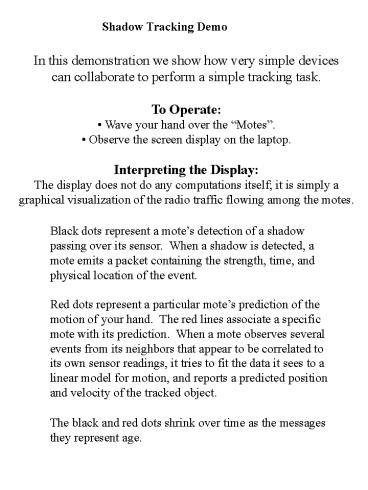
Shadow Tracking Demo
In this demonstration we show how very simple
devices can collaborate to perform a simple
tracking task.
- To Operate
- Wave your hand over the Motes.
- Observe the screen display on the laptop.
- Interpreting the Display
- The display does not do any computations itself
it is simply a graphical visualization of the
radio traffic flowing among the motes.
Black dots represent a motes detection of a
shadow passing over its sensor. When a shadow is
detected, a mote emits a packet containing the
strength, time, and physical location of the
event.
Red dots represent a particular motes prediction
of the motion of your hand. The red lines
associate a specific mote with its prediction.
When a mote observes several events from its
neighbors that appear to be correlated to its own
sensor readings, it tries to fit the data it sees
to a linear model for motion, and reports a
predicted position and velocity of the tracked
object.
The black and red dots shrink over time as the
messages they represent age.
2
About the Hardware
The hardware platform used in this demo is the
Macro Mote platform developed at Berkeley
The objective of the macro mote was to provide
a scaled-up development platform for a device
that could plausibly be shrunk to the size of a
dust particle. Consequently, the mote has very
limited computational capability
- Atmel AVR 8-bit RISC processor, 4MHz
- 512 bytes RAM
- 8KB flash program memory (2 bytes/instruction)
- RFM 918 MHz radio, in OOK mode, 19200 baud
- Transmit power control for variable range
- Analog sampling of baseband signal for RSSI
- CSMA MAC implemented in software on AVR
- Analog sensor interfaces
- 8 ADC channels
These limitations introduce numerous challenges.
Because of the limited memory and communication
resources, it is impossible to keep or transmit
large amounts of historical sensor data, time
series, etc. Thus, algorithms must emphasize
on-board and in-network processing, data
aggregation, and adaptive fidelity, and must
avoid centralized computations.
3
Detection and Tracking Algorithms
The system shown in this demo is composed of
several concurrently operating algorithms
- Time Series and Long Term Average. The light
sensor is sampled at 16Hz, and a small time
series is kept in a ring buffer. A long-term
average is computed by adding each new sample
into a sum and subtracting out the previous
average value. - Event Detection. The minimum value in the buffer
is computed when the minimum value is followed
by a rise above a threshold, a packet is
scheduled containing the time of the minimum, the
motes location, and the value of the minimum,
normalized against the long-term average. - Recent Events from Neighbors. Detected events and
events reported by neighbors are analyzed if
they are recent and nearby, they are inserted
into a buffer of recent events. If we have at
least one recent detection, we search the buffer
for the longest linear sequence, deduce a
velocity vector, and schedule ourselves to emit a
track event packet. - Packet Scheduling. In order to avoid broadcast
floods, packets are scheduled to be emitted after
a short random delay. During that time, new data
can override the packet in the buffer if the
new data is better as judged by the
application. For example - A deeper minimum event overrides a shallower
event - An event detection takes precedence over a
track prediction, but a track prediction can
wait in a separate queue. - A newer and longer track has precedence over a
shorter track - Future Work
- Recent Tracks from Neighbors. Track messages
reported by neighbors are used to weight
alternative track hypotheses. - Suppression of Redundant Tracks. A track
message from a neighbor will suppress an
equivalent track scheduled to be sent.
4
(No Transcript)
Recommended
CrystalGraphics Presentations


