
AcidBase Titrations - PowerPoint PPT Presentation
1 / 26
Title:
AcidBase Titrations
Description:
To best understand titrations and the information they provide, it is necessary ... Assume strong acid and base completely dissociate ... – PowerPoint PPT presentation
Number of Views:2177
Avg rating:3.0/5.0
Title: AcidBase Titrations
1
Acid-Base Titrations
- Introduction
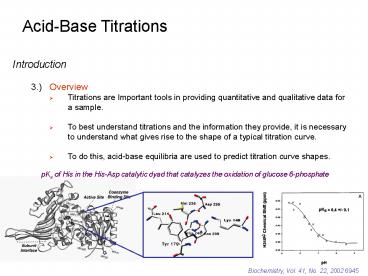
- 3.) Overview
- Titrations are Important tools in providing
quantitative and qualitative data for a sample. - To best understand titrations and the information
they provide, it is necessary to understand what
gives rise to the shape of a typical titration
curve. - To do this, acid-base equilibria are used to
predict titration curve shapes.
pKa of His in the His-Asp catalytic dyad that
catalyzes the oxidation of glucose 6-phosphate
Biochemistry, Vol. 41, No. 22, 2002 6945
2
Acid-Base Titrations
- Titration of Strong Base with Strong Acid
- 1.) Graph of How pH changes as Titrant is Added
- Assume strong acid and base completely dissociate
- Any amount of H added will consume a
stoichiometric amount of OH- - Reaction Assumed to go to completion
- Three regions of the titration curve
- Before the equivalence point, the pH is
determined by excess OH- in the solution - At the equivalence point, H is just sufficient
to react with all OH- to make H2O - After the equivalence point, pH is determined by
excess H in the solution.
3
Acid-Base Titrations
- Titration of Strong Base with Strong Acid
- 1.) Graph of How pH changes as Titrant is Added
- Remember, equivalence point is the ideal goal
- Actually measure End Point
- Marked by a sudden physical change color,
potential - Different Regions require different kinds of
calculations - Illustrated examples
- The true titration reaction is
Titrant
Analyte
4
Acid-Base Titrations
- Titration of Strong Base with Strong Acid
- 2.) Volume Needed to Reach the Equivalence Point
- Titration curve for 50.00 mL of 0.02000 M KOH
with 0.1000 M HBr - At equivalence point, amount of H added will
equal initial amount of OH-
mmol of OH- being titrated
mmol of HBr at equivalence point
When 10.00 mL of HBr has been added, the
titration is complete. Prior to this point,
there is excess OH- present. After this point
there is excess H present.
5
Acid-Base Titrations
- Titration of Strong Base with Strong Acid
- 3.) Before the Equivalence Point
- Titration curve for 50.00 mL of 0.02000 M KOH
with 0.1000 M HBr - Equivalence point (Ve) when 10.00 mL of HBr has
been added - When 3.00 mL of HBr has been added, reaction is
3/10 complete
Initial volume of OH-
Calculate Remaining OH-
Total volume
Fraction of OH- Remaining
Initial concentration of OH-
Dilution Factor
Calculate H and pH
6
Acid-Base Titrations
- Titration of Strong Base with Strong Acid
- 4.) At the Equivalence Point
- Titration curve for 50.00 mL of 0.02000 M KOH
with 0.1000 M HBr - Just enough H has been added to consume OH-
- pH determined by dissociation of water
- pH at the equivalence point for any strong acid
with strong base is 7.00 - Not true for weak acid-base titration
Kw
Kw 1x10-14
x x
7
Acid-Base Titrations
- Titration of Strong Base with Strong Acid
- 5.) After the Equivalence Point
- Titration curve for 50.00 mL of 0.02000 M KOH
with 0.1000 M HBr - Adding excess HBr solution
- When 10.50 mL of HBr is added
Calculate volume of excess H
Calculate excess H
Volume of excess H
Initial concentration of H
Dilution factor
Total volume
Calculate pH
8
Acid-Base Titrations
- Titration of Strong Base with Strong Acid
- 6.) Titration Curve
- Rapid Change in pH Near Equivalence Point
- Equivalence point is where slope is greatest
- Second derivative is 0
- pH at equivalence point is 7.00, only for strong
acid-base - Not True if a weak base-acid is used
9
Acid-Base Titrations
- Titration of Weak Acid with Strong Base
- 1.) Four Regions to Titration Curve
- Before any added base, just weak acid (HA) in
water - pH determined by Ka
- With addition of strong base ? buffer
- pH determined by Henderson Hasselbach equation
- At equivalence point, all HA is converted into A-
Ka
Kb
10
Acid-Base Titrations
- Titration of Weak Acid with Strong Base
- 1.) Four Regions to Titration Curve
- Beyond equivalence point, excess strong base is
added to A- solution - pH is determined by strong base
- Similar to titration of strong acid with strong
base - 2.) Illustrated Example
- Titration of 50.00 mL of 0.02000 M MES with
0.1000 M NaOH - MES is a weak acid with pKa 6.27
- Reaction goes to completion with addition of
strong base
11
Acid-Base Titrations
- Titration of Weak Acid with Strong Base
- 3.) Volume Needed to Reach the Equivalence Point
- Titration of 50.00 mL of 0.02000 M MES with
0.1000 M NaOH - Reaction goes to completion with addition of
strong base - Strong plus weak react completely
mmol of HA
mmol of base
12
Acid-Base Titrations
- Titration of Weak Acid with Strong Base
- 4.) Region 1 Before Base is Added
- Titration of 50.00 mL of 0.02000 M MES with
0.1000 M NaOH - Simply a weak-acid problem
Ka
Ka 10-6.27
Calculate H
F - x x x
Calculate pH
13
Acid-Base Titrations
- Titration of Weak Acid with Strong Base
- 5.) Region 2 Before the Equivalence Point
- Titration of 50.00 mL of 0.02000 M MES with
0.1000 M NaOH - Adding OH- creates a mixture of HA and A- ?
Buffer - Calculate pH from A-/HA using
Henderson-Hasselbach equation
Simply the difference of initial quantities
Calculate A-/HA
Simply ratio of volumes
Amount of added NaOH is 3 mL with equivalence
point is 10 mL
Calculate pH
14
Acid-Base Titrations
- Titration of Weak Acid with Strong Base
- 5.) Region 2 Before the Equivalence Point
- Titration of 50.00 mL of 0.02000 M MES with
0.1000 M NaOH - pH pKa when the volume of titrant equals ½Ve
15
Acid-Base Titrations
- Titration of Weak Acid with Strong Base
- 5.) Region 3 At the Equivalence Point
- Titration of 50.00 mL of 0.02000 M MES with
0.1000 M NaOH - Exactly enough NaOH to consume HA
- The solution only contains A- ? weak base
Kb
F - x
x x
16
Acid-Base Titrations
- Titration of Weak Acid with Strong Base
- 5.) Region 3 At the Equivalence Point
- Titration of 50.00 mL of 0.02000 M MES with
0.1000 M NaOH
Calculate Formal concentration of A-
A- is no longer 0.02000 M, diluted by the
addition of NaOH
Initial volume of HA
Initial concentration of HA
Dilution factor
Total volume
17
Acid-Base Titrations
- Titration of Weak Acid with Strong Base
- 5.) Region 3 At the Equivalence Point
- Titration of 50.00 mL of 0.02000 M MES with
0.1000 M NaOH
Calculate OH-
Calculate pH
pH at equivalence point is not 7.00
pH will always be above 7.00 for titration of a
weak acid because acid is converted into
conjugate base at the equivalence point
18
Acid-Base Titrations
- Titration of Weak Acid with Strong Base
- 5.) Region 4 After the Equivalence Point
- Titration of 50.00 mL of 0.02000 M MES with
0.1000 M NaOH - Adding NaOH to a solution of A-
- NaOH is a much stronger base than A-
- pH determined by excess of OH-
Calculate volume of excess OH-
Amount of added NaOH is 10.10 mL with equivalence
point is 10 mL
Calculate excess OH-
Calculate pH
19
Acid-Base Titrations
- Titration of Weak Acid with Strong Base
- 5.) Titration Curve
- Titration of 50.00 mL of 0.02000 M MES with
0.1000 M NaOH - Two Important Features of the Titration Curve
Equivalence point OH- HA Steepest part of
curve Maximum slope
pHpKa Vb ½Ve Minimum slope
Maximum Buffer Capacity
20
Acid-Base Titrations
- Titration of Weak Acid with Strong Base
- 5.) Titration Curve
- Depends on pKa or acid strength
- Inflection point or maximum slope decreases with
weaker acid - Equivalence point becomes more difficult to
identify
weak acid ? small slope change in
titration curve Difficult to detect equivalence
point
Strong acid ? large slope change in
titration curve Easy to detect equivalence point
21
Acid-Base Titrations
- Titration of Weak Acid with Strong Base
- 5.) Titration Curve
- Depends on acid concentration
- Inflection point or maximum slope decreases with
lower acid concentration - Equivalence point becomes more difficult to
identify - Eventually can not titrate acid at very low
concentrations
High concentration ? large slope change in
titration curve Easy to detect
equivalence point
Low concentration ? small slope change in
titration curve Difficult to
detect equivalence point At low enough
concentration, can not detect change
22
Acid-Base Titrations
- Titration in Polyprotic Systems
- 1.) Principals for Monoprotic Systems Apply to
Diprotic and Triprotic Systems - Multiple equivalence points and buffer regions
- Multiple Inflection Points in Titration Curve
Two equivalence points
Kb1
Kb2
23
Acid-Base Titrations
- End Point Determination
- 1.) Indicators compound added in an acid-base
titration to allow end point detection - Common indicators are weak acids or bases
- Different protonated species have different colors
pK 1.7
pK 8.9
24
Acid-Base Titrations
- End Point Determination
- 2.) Choosing an Indicator
- Want Indicator that changes color in the vicinity
of the equivalence point and corresponding pH - The closer the two match, the more accurate
determining the end point will be
Bromocresol purple color change brackets the
equivalence point and is a good indicator choice
Bromocresol green will change color Significantly
past the equivalence point resulting in an error.
25
Acid-Base Titrations
- End Point Determination
- 2.) Choosing an Indicator
The difference between the end point (point of
detected color change) and the true equivalence
point is the indicator error Amount of indicator
added should be negligible
Indicators cover a range of pHs
26
Acid-Base Titrations
- End Point Determination
- 3.) Example
a) What is the pH at the equivalence point when
0.100 M hydroxyacetic acid is titrated with
0.0500 M KOH? b) What indicator would be a good
choice to monitor the endpoint?
Recommended
CrystalGraphics Presentations


