Saint John River - PowerPoint PPT Presentation
1 / 1
Title: Saint John River
1
Environmental Reporting Series 2007
New Brunswick Watersheds
Saint John River
Location
Community Involvement
The Saint John River originates in Somerset
County, Maine and empties into the Bay of Fundy.
The river drains an area of approximately 55 500
km2 (about half of which lies in Canada). The
principal tributaries of the Saint John River are
the Aroostook, Madawaska, Nashwaak, Oromocto, St.
Francis, Kennebecasis, Canaan and Tobique rivers.
There are numerous community groups that are
involved with maintaining the ecological
integrity of the Saint John watershed. These
groups include the La Societé dAménagement de la
Rivière Madawaska et du lac Temiscouata,
Meduxnekeag Watershed Association, the Nashwaak
Watershed Association, Canaan-Washademoak
Watershed Association and the Kennebecasis
Watershed Restoration Committee. Also, the
Canadian Rivers Institute of the University of
New Brunswick is currently conducting various
research projects throughout the watershed.
Geology
Land Use
The Saint John River is used for many activities
such as camping, boating, and fishing.
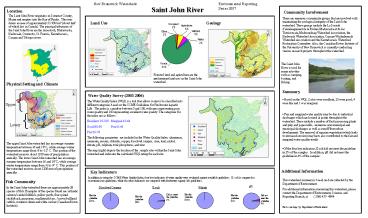
Forested land and agriculture are the predominant
land uses in the Saint John watershed.
Physical Setting and Climate
Summary
- Based on the WQI, 2 sites were excellent, 23
were good, 4 were fair and 1 was marginal. - Fair and marginal water quality may be due to
industrial discharges which are located at points
throughout the watershed. These include a number
of food processing plants and pulp and paper
mills, numerous non municipal and municipal
discharges as well as runoff from urban
development. The removal of riparian vegetation
(which leads to increased erosion) may have also
contributed to the fair and marginal water
quality results. - Of the four key indicators, E.coli did not meet
the guideline in 2 of the samples. In addition,
pH did not meet the guideline in 4 of the
samples.
Water Quality Survey (2003-2006)
Upper
Lower
The upper Saint John watershed has an average
summer temperature between 16 and 18C, while
average winter temperatures range from -8 to -12
C. This portion of the watershed receives about
1100 mm of precipitation annually. The lower
Saint John watershed has an average summer
temperature between 16 and 18C, while average
winter temperatures range from -6 to -9 C. This
portion of the watershed receives about 1200 mm
of precipitation annually.
Additional Information
Key Indicators
This watershed summary is based on data
collected by the Department of Environment. For
additional information concerning this watershed,
please contact the Department of Environment,
Sciences and Reporting Branch, at ( 506)
457- 4844. Photos and maps by Department of
Environment.
In addition to using the CCME Water Quality
Index, four key indicators of water quality were
evaluated against available guidelines. E. coli
is compared to recreational use guidelines, while
the other indicators are compared with freshwater
aquatic life guidelines.
Fish Community
pH
Dissolved Oxygen
E.coli
Nitrate
In the Saint John watershed there are
approximately 28 species of fish. Examples of the
species found are Atlantic salmon, banded
killifish, yellow perch, four spined stickleback,
gaspereau, smallmouth bass, brown bullhead
catfish, common shiner and white sucker (Canadian
Rivers Institute).
Did not meet the guideline 2
Met the guideline 100
Met the guideline 100
Met the guideline 96
Did not meet the guideline 4
Met the guideline 98


