
Dotplot PowerPoint PPT Presentations
All Time
Recommended

For such a distribution values below the median (here M = 29.17) tend to be ... We say 'Fruit flies longevities have a right skewed distribution.' Histogram ...
| PowerPoint PPT presentation | free to view

... databasene med en rigor s Smith-Waterman-algoritme er ressurskrevende (men mulig) ... regnes s ut a la Smith-Waterman, men begrenset til ruter i et b nd ...
| PowerPoint PPT presentation | free to view

Quantitative Variables DISPLAYS Quantitative Displays 1. Dotplot(line plot) number line with dots or x s representing each observation above it s value ...
| PowerPoint PPT presentation | free to download
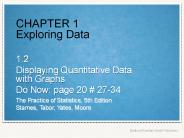
CHAPTER 1 Exploring Data 1.2 Displaying Quantitative Data with Graphs Do Now: page 20 # 27-34 MAKE and INTERPRET dotplots and stemplots of quantitative data DESCRIBE ...
| PowerPoint PPT presentation | free to download
Activity 7 - 3 The Class Survey Objectives Organize data with frequency tables, dotplots, ... Typical graphs of categorical data: Pie Charts; ...
| PowerPoint PPT presentation | free to download

... dotplot to the right shows Kentucky Derby winning times, plotting each annual race with a dot. ... Kentucky Derby Winning. Times, 1875-2004. Slide 4- 9 ...
| PowerPoint PPT presentation | free to view

Insurance company use statistical techniques to set auto insurance rates. ... Separate dotplots of graduation rates for Texas and California ...
| PowerPoint PPT presentation | free to view

The goal is not simply to construct graphs and diagrams but rather to learn ... OGIVE. An ogive is a line graph that depicts cumulative frequencies. DOTPLOT ...
| PowerPoint PPT presentation | free to view

Smith-Waterman, Gotoh, etc., guarantee the best-scoring alignment ... Acceleration of the Smith-Waterman algorithm. Identify strong diagonals in dotplots ...
| PowerPoint PPT presentation | free to view

---- (Principles of Scoring Matrices) Blosum (The Blosum matrices)
| PowerPoint PPT presentation | free to view

Basics of Sequence Alignment and Weight Matrices and DOT Plot G P S Raghava Email: raghava@imtech.res.in Web: http://imtech.res.in/raghava/
| PowerPoint PPT presentation | free to download

Chapter 1: Exploring Data ... Things to look for Center Shape Spread Outliers Cautions: Pancake and skyscraper effect Stemplots A stem consists of all but the ...
| PowerPoint PPT presentation | free to view

Basics of Sequence Alignment and Weight Matrices and DOT Plot G P S Raghava Email: raghava@imtech.res.in Web: http://imtech.res.in/raghava/ Importance of Sequence ...
| PowerPoint PPT presentation | free to view

CHAPTER 1 Exploring Data 1.2 Displaying Quantitative Data with Graphs
| PowerPoint PPT presentation | free to view

Chapter 1: Exploring Data Section 1.2 Displaying Quantitative Data with Graphs The Practice of Statistics, 4th edition - For AP* STARNES, YATES, MOORE
| PowerPoint PPT presentation | free to view

Voyage of the Reverser A Visual Study of Binary Species Greg Conti // West Point // gregory.conti@usma.edu Sergey Bratus // Dartmouth // sergey@cs.dartmouth.edu
| PowerPoint PPT presentation | free to download

Chapter 1: Exploring Data 1.1 Displaying Distributions with Graphs
| PowerPoint PPT presentation | free to view
Descriptive Statistics Summarizing data using graphs Which graph to use? Depends on type of data Depends on what you want to illustrate Depends on available ...
| PowerPoint PPT presentation | free to download

Chapter 1 The Role of Statistics and the Data Analysis Process What is variability? Suppose you went into a convenience store to purchase a soft drink.
| PowerPoint PPT presentation | free to download

A Parallel, High Performance Implementation of the Dot Plot Algorithm Chris Mueller July 8, 2004 Overview Motivation Availability of large sequences Dot plot offers ...
| PowerPoint PPT presentation | free to view

AP Statistics Introduction & Chapter 1.1 Variables, Distributions & Graphs Goals: What will we know and be able to do as a result of today s Lesson?
| PowerPoint PPT presentation | free to download

Pairwise sequence alignment (practice) * * Manual Work: Write down the amino acid sequences derived from all six possible reading frames of: seq1 ACTGTCGC Open the ...
| PowerPoint PPT presentation | free to download
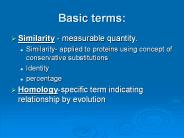
Basic terms: Similarity - measurable quantity. Similarity- applied to proteins using concept of conservative substitutions Identity percentage Homology-specific term ...
| PowerPoint PPT presentation | free to download

One-Way Analysis of Variance to compare 2 or population means Does distance it takes to stop car at 60 mph depend on tire brand? Comparison of Five Tire Brands ...
| PowerPoint PPT presentation | free to view
BD FACSDiVa 4.1 An introduction FACSDiVa Software The new digital acquisition platform introduces a complete new software concept from BD The software runs on a ...
| PowerPoint PPT presentation | free to download
Displaying Data with Graphs Dot Plot Stemplot Describing a Graph Center Shape Spread Center If you had to pick a single number to describe all the data the center ...
| PowerPoint PPT presentation | free to download

Distributions and Graphical Representations Types of Variables Categorical variables or qualitative identifies basic differentiating characteristics of the population ...
| PowerPoint PPT presentation | free to view

Title: Types of Distributions Author: Doug Fritz Last modified by: payneae Created Date: 7/18/2001 8:51:58 PM Document presentation format: On-screen Show (4:3)
| PowerPoint PPT presentation | free to view

BIRTH OF AN ACTIVITY Beth Chance Department of Statistics Cal Poly San Luis Obispo bchance@calpoly.edu
| PowerPoint PPT presentation | free to download

Title: Types of Distributions Author: Doug Fritz Last modified by: Plano ISD Created Date: 7/18/2001 8:51:58 PM Document presentation format: On-screen Show
| PowerPoint PPT presentation | free to view

OC Spermatophyta; Magnoliophyta; eudicotyledons; core ... (Smith & Waterman) Identifies the region with the best. local similarity. Algorithm: Similarity ...
| PowerPoint PPT presentation | free to view
Title: PowerPoint Presentation Last modified by: Kevin Wampler Created Date: 1/1/1601 12:00:00 AM Document presentation format: On-screen Show Other titles
| PowerPoint PPT presentation | free to download

Smith and Waterman. Pairwise Sequence Alignment ... Extended Smith & Waterman. To get multiple local alignments: delete regions around best path ...
| PowerPoint PPT presentation | free to download
... Sample of 25 Mustangs listed on Autotrader.com. Find a confidence interval for the . slope. of a regression line to predict prices of used Mustangs based on their ...
| PowerPoint PPT presentation | free to download

Small enough to summarize well but large enough to show characteristics ... their political party affiliations as Democratic (D), Republican (R), or Other (O) ...
| PowerPoint PPT presentation | free to view

Chapter 3: Descriptive Analysis and Presentation of Bivariate Data Chapter Goals To be able to present bivariate data in tabular and graphic form.
| PowerPoint PPT presentation | free to view

At the end of WWII, the serial-number estimate for German tank production was ... 4. Plug in your sample of 5 serial numbers from #1 to get an estimate of N using ...
| PowerPoint PPT presentation | free to view

Scale the axis based on the values of the variable. Mark a dot above the number on ... Too few give a skyscraper effect, too many give us breakfast (pancake) ...
| PowerPoint PPT presentation | free to view

Smith-Waterman, BLAST. Number of sequences. Pairwise alignment - only two sequences compared. Dotmatrix, Needleman-Wunsch, Smith-Waterman, BLAST ...
| PowerPoint PPT presentation | free to view
Probability and Statistics for Engineers Descriptive Statistics Measures of Central Tendency Measures of Variability Probability Distributions Discrete
| PowerPoint PPT presentation | free to download

Pair-wise and Multiple Sequence Alignment Using Dynamic Programming (Local & Global Alignment) ... of Two Sequences (Pair-wise Alignment) The Scoring Schemes or ...
| PowerPoint PPT presentation | free to download

For more course tutorials visit www.tutorialrank.com MATH 533 Week 1 Homework Problems MATH 533 Week 1 Quiz MATH 533 Week 2 Homework Problems MATH 533 Week 2 Course Project: AJ Davis Department Stores (Part A) MATH 533 Week 2 DQ MATH 533 Week 2 Quiz MATH 533 Week 3 Homework Problems MATH 533 Week 3 DQ MATH 533 Week 3 Quiz MATH 533 Week 4 Homework Problems MATH 533 Week 4 Quiz
| PowerPoint PPT presentation | free to download

Local alignment (Smith-Waterman) BLAST (simplified Smith-Waterman) FASTA (simplified Smith-Waterman) BESTFIT (GCG program) Global alignment (Needleman-Wunsch) ...
| PowerPoint PPT presentation | free to view

Number of Cellana per quadrat, Cheviot Beach survey 5. No. quadrats = 15. Boxplot. 25% of values ... SPLOM for Cheviot Beach survey 5. CELLANA - numbers of ...
| PowerPoint PPT presentation | free to view

... everyday decision: Should we go out for a sport that involves the risk of injury. ... Example: A consumer group conducts crash tests of new model cars. ...
| PowerPoint PPT presentation | free to view

Sequence Alignment
| PowerPoint PPT presentation | free to view

Chapter 1: Exploring Data Introduction Data Analysis: Making Sense of Data The Practice of Statistics, 4th edition - For AP* STARNES, YATES, MOORE
| PowerPoint PPT presentation | free to view

Title: Concetti introduttivi all analisi delle Biosequenze Author: pp pp Last modified by: mfasano Created Date: 5/1/2002 4:20:34 PM Document presentation format
| PowerPoint PPT presentation | free to view

Introduction to Statistical Computing Methods in Clinical Research July 2000 Health Service Cost Review Commission (HSCRC) Data Discharge data on patients who ...
| PowerPoint PPT presentation | free to download

What is the average shell thickness of bald eagle eggs? ... ( We are interested in the effect of certain experimental conditions on a response ...
| PowerPoint PPT presentation | free to view

Is there a difference between male/female heartbeats? Put pulse rates for class (m/f) on board Are there any unusual pulse rates? Calculate/compare using SOCS 1.1 ...
| PowerPoint PPT presentation | free to view

An EDA allows us to identify patterns and departures from patterns in distributions. ... EDA Summary. Look for overall pattern and departures from pattern ...
| PowerPoint PPT presentation | free to view

General ('X and Y have the same fold') Specific (comparative modeling) ... Affine: scores for opening & extending gaps. Local: *gaps at the ends are 'free' ...
| PowerPoint PPT presentation | free to view

How a non-linear function shows up on a 'residual versus fits' plot ... Or, the spread of the residuals can vary in some complex fashion. ...
| PowerPoint PPT presentation | free to view

The Laboratory of Ornithology holds an annual Christmas Bird Count in which ... A study examining the health risks of smoking measured the cholesterol levels of ...
| PowerPoint PPT presentation | free to view

Graphics. Tutors Office Hours. Monday: 9-10 (Jenny) and 11:30-1:30 (Lisa) ... 11. x categorical, y continuous: bwplot. Y continuous, X has 2 levels, 'A' and 'B' ...
| PowerPoint PPT presentation | free to download