
Environmental Product Design Example: Access, Mobility, Vehicles - PowerPoint PPT Presentation
1 / 13
Title: Environmental Product Design Example: Access, Mobility, Vehicles
1
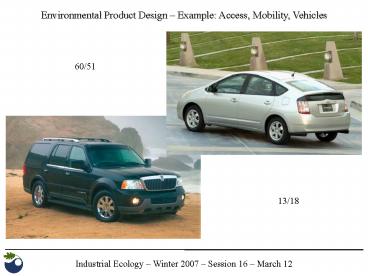
Environmental Product Design Example Access,
Mobility, Vehicles
60/51
13/18
2
Example Reducing the Greenhouse Gas Emissions
from Motor Vehicles
US Greenhouse Gas Emissions by Sector (in million
metric tons)
Source US Emission Inventory 2005, EPA
3
Example Reducing the Greenhouse Gas Emissions
from Motor Vehicles
US CO2 emissions from transportation vs. total
(in MMT)
32.3
27.6
Source http//www.eia.doe.gov/
4
Example Reducing the Greenhouse Gas Emissions
from Motor Vehicles
5
Example Reducing the Greenhouse Gas Emissions
from Motor Vehicles
6
Light-Duty Automotive Technology and Fuel Economy
Trends
Source US EPA (2003) Light-Duty Automotive
Technology and Fuel Economy Trends
7
Pressure to reduce GHG emissions from vehicles is
increasing
- European Union
- Goal Average of 120 g CO2 per km driven for
passenger cars by 2010 - 1999/2000 Voluntary agreements with car
manufacturers - California - Assembly Bill 1493
- Goal Average of 127 g CO2eq per km driven for
passenger cars by 2016 - 2002 AB 1493 passes Assembly and Senate
- 2004 AB 1493 is approved by Governor
- New York State
- 2005 Official proposal to adopt Californias
regulation - Canada
- 2005 Voluntary agreements with car
manufacturers
Agreements / regulations do not use a full life
cycle perspective
8
Typical life cycle GHG emissions of a passenger
car
Total Compact 50 tonnes of CO2
eq Midsize 60-70 tonnes of CO2 eq SUV 80
tonnes of CO2 eq
5-15
4-5
80-90
0-1
Vehicle GHG reduction strategies focus on the use
phase
9
There are many ways to reduce use phase GHG
emissions of vehicles
- Power train modifications HEV, FCV, BEV
- Engine modifications Variable valve timing and
lift, cylinder shut-off - Fuel combustion modifications Turbocharger,
CVR, direct injection - Transmission modifications Continuously
variable transmission, shifting
schedules - Alternative fuels Biodiesel, ethanol, hydrogen
- Reduction of aerodynamic drag Body shape
- Reduction of rolling resistance Tires
- Vehicle mass reduction Smaller vehicles, better
packaging, light-weight materials
10
Energy efficiencies of ICEV, HEV, BEV, FCV
Internal combustion engine vehicle (ICEV)
Fuel productionand delivery
ICE, powertrain friction
0.88 x 0.16
0.14
Hybrid electric vehicle (HEV)
Fuel productionand delivery
Electric motor, ICE, battery powertrain friction
0.88 x 0.32
0.28
Battery electric vehicle (BEV)
Power plant
Battery
Electric motor, powertrain friction
Electricity transmission
0.35 0.55 x 0.93 x
0.8 x 0.8
0.2 0.33
Fuel cell vehicle (FCV)
Fuel cell
Electric motor, powertrain friction
Compression, transmission
Reformation
0.8 x 0.75 x
0.5 x 0.8
0.24
11
Primary energy efficiencies of ICEV, HEV, BEV, FCV
Energy content of gasoline 46.7 MJ per kg Energy
content of hydrogen 141.9 MJ per kg
12
Life cycle GHG emissions ICEV versus HEV
Average lifecycle GHG (in kg CO2eq) emissions of
a Civic Hybrid (HEV) and a Civic LX (ICEV)
Source Bren Group Project on HEV (Class of
2005) (Average for manual and automatic
transmission)
13
Reading for Wednesday, 14 MarchNokia (2005)
IPP Pilot Project Stage II Final Report
Options for Improving Life Cycle Environmental
Performance of Mobile Phones(posted on course
website as Nokia 2005)
Recommended
CrystalGraphics Presentations


