Coolbaugh DOE Peer Review 2003 - PowerPoint PPT Presentation
1 / 33
Title: Coolbaugh DOE Peer Review 2003
1
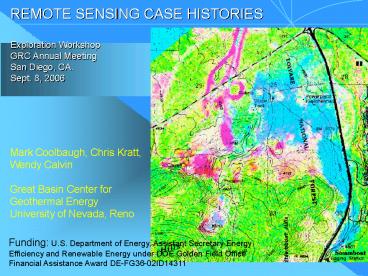
REMOTE SENSING CASE HISTORIES Exploration
Workshop GRC Annual Meeting San Diego, CA.
Sept. 8, 2006
Mark Coolbaugh, Chris Kratt, Wendy Calvin Great
Basin Center for Geothermal Energy University of
Nevada, Reno
Funding U.S. Department of Energy, Assistant
Secretary Energy Efficiency and Renewable Energy
under DOE Golden Field Office Financial
Assistance Award DE-FG36-02ID14311
2
Silicified sediments (opal)
All blind geothermal systems in Nevada that are
currently producing electricity have surface
signatures
Carbonate tufa/travertine
Clay alteration
Borate and sulfate evaporites
3
Remote Sensing Case Histories
Thermal infrared (TIR) Steamboat Springs Bradys
Hot Springs Short-wave Infrared (SWIR) Bradys
Hot Springs/Desert Peak Two Other Examples will
be discussed as Short Stories Pyramid Lake
(sulfates) Rhodes Marsh (borates)
4
Main Terrace, Steamboat Springs, NV. has a high
albedo (high reflectivity) and thus tends to stay
cool, and it has a low thermal inertia (cools off
quickly at night).
Effectiveness of pre-dawn thermal images limited
in part because of diurnal heating effects
related to the sun
5
Steamboat Springs, NV. enhancement with TIMS
imagery (see notes below)
Red temperature anomaly
N
Main Terrace
500m
Before Enhancement
After Enhancement
6
Sources of Diel (24-hour) Temperature Variations
Thermal Inertia
Geothermal
Albedo ( topography)
Emissivity
Other factors being equal, surface materials with
different thermal inertias will have the same
average 24-hour temperature
From Elachi (1987) and Watson (1973)
7
Day and night thermal images can be weighted
together to minimize temperature differences
caused by thermal inertia
8
Sources of Diel (24-hour) Temperature Variations
Thermal Inertia
Geothermal
Albedo ( topography)
Emissivity
Albedo and topographic slope influence
surface temperatures because they determine
how much sunlight is absorbed at the surface
From Elachi (1987) and Watson (1973)
9
Hypothetical cross-section across the Main
Terrace at Steamboat Springs. Our approach is to
subtract the albedo (and topographic and thermal
inertia) contribution from the net temperature
image, to better discern geothermal effects in
the residual image. This works as a first
approximation.
10
AVIRIS Band 19 (green light) Advanced
argillic alteration and sinter have high albedos.
As a consequence, surface temperatures in these
areas tend to be cooler than in surrounding areas.
Advance argillic alter.
Sinter
N
1 km
11
TIMS day band 3 South-facing slopes appear
brighter in imagery but are warmer because they
receive more sunlight. High albedo areas
(previous slide) also appear bright but are
relatively cool. 1 km
N
12
Topographic Shading The heating effects
caused by topography can be predicted digitally
with the help of a DEM (digital elevation
model). 1 km
ENVI Shaded Relief Image - scaled from 0 to 1
- cos (angle between surface normal and
sun rays) - specify time, date, lat, long
N
13
HEAT ENERGY EQUATION adpated from Watson (1973)
- FSn ? S0 (1 - A) M(Z) cosZ
- H Time Integral of K1 S I (1 A)
- H(t) ? Ki Si D I (1 A) T K (1 A) ?i (Si
Di Ii Ti) - I solar intensity, D decay constant
- T time
14
DEM-modified method for calculating albedo
15
Heat Flux Anomalies Steamboat
Springs Average Day Night TIMS band 5
radiance with subtraction for slope aspect
albedo With Topo Shading Anomaly Strength red
strong yellow-green
moderate blue weak 1 km
N
16
Enhanced image
Brady Fumaroles
N
4km
Image processing minimizes false thermal
anomalies (those un-related to geothermal
activity) while leaving geothermal signatures
unaffected
Night Temp image
17
EXAMPLE Albedo Effects at open-pit diatomite
mines
RGB/321
Day
Image processing minimizes temperature
differences caused by differences in surface
albedo
N
Final Processed
1 km
Night
18
EXAMPLE Topographic effects at southeast and
southwest-facing slopes
N
Day, Final Processed
1 km
Day
Night, Final Processed
G
Image processing minimizes temperature
differences caused by topographic slope
orientation relative to sun (residual temperature
variations are due to altitude)
N
1 km
b)
Night
19
EXAMPLE Areas with strong variations in thermal
inertia
sand
sand
Day image after albedo/topo adjustment
RGB/321
Image processing minimizes temperature
differences caused by differences in the thermal
inertia of surface materials
Night image after albedo/topo adjustment
N
(Sand has a low thermal inertia)
Final processed image (residual temp variations
due to altitude)
1 km
20
N
Geothermal Power plant
1 km
Onion plant
and with GPS-mapped thermal anomalies added
ASTER TIR anomaly after processing
Bradys Hot Springs Fumarole/Warm Ground Anomalies
21
Remote Sensing Case Histories
Thermal infrared (TIR) Steamboat Springs Bradys
Hot Springs Short-wave Infrared (SWIR) Bradys
Hot Springs/Desert Peak Two Other Examples will
be discussed as Case Histories Pyramid Lake
(sulfates) Rhodes Marsh (borates)
22
Where?
The Great Basin
Brady Desert Peak Geothermal Field
Hot Springs Mountains, Nevada, USA
N
23
HYMAP
122 km2 of coverage
Brady
- Airborne hyperspectral scanner
- 127 contiguous channels from .45 2.5
micrometers (VNIR-SWIR) - 3 meter spatial resolution
- SN gt 5001
Desert Peak
4.5 km
24
Tufa depostion- occurs where spring water and
lake water mix- precipitates CaCo3
shoreline tufa
structurally controlled sub-lacustrine tufa
0.5km
25
Relative Band Depth (RBD) best for mapping
carbonate
(108 116)/120
2.33
26
RBD threshold
RBD result
Unique values
Using HyMap Hyperspectral Imagery to Map
Carbonates
27
Southward structural extensions of Bradys Fault
defined by carbonate distribution
28
Absorption features of Opaline Sinter
USGS library spectra
ASD field average
chalcedony
opal
SiO2 nH2O
Image spectra
ASD lab sinter
MTMF mapping routine
29
(No Transcript)
30
Sinter at Desert Peak
1 km
Float of silicified roots
Mapped by field geologists
Remotely mapped
Sometimes gradational variations are
almost impossible to map with conventional methods
31
Dixie Meadows and points south
acid-sulfate alt.
eugsterite Na4Ca(SO4)2 H2O
missing data
gypsum
vegetation
10 km
Another example Dixie Valley
32
Conclusions
Remote Sensing can be an effective tool in
geothermal exploration, even for blind geothermal
systems, and even where previous exploration has
spanned over many years.
33
The End


