
The Asian Dust Events of April 1998 - PowerPoint PPT Presentation
1 / 14
Title:
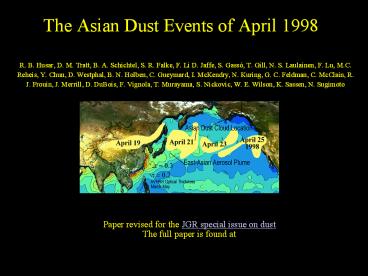
The Asian Dust Events of April 1998
Description:
The Asian Dust ... On April 15 and 19 1998, two unusually intense dust storms ... Yellow muddy rain was reported from Beijing on April 16-17. The April ... – PowerPoint PPT presentation
Number of Views:50
Avg rating:3.0/5.0
Title: The Asian Dust Events of April 1998
1
The Asian Dust Events of April 1998
- R. B. Husar, D. M. Tratt, B. A. Schichtel, S. R.
Falke, F. Li D. Jaffe, S. Gassó, T. Gill, N. S.
Laulainen, F. Lu, M.C. Reheis, Y. Chun, D.
Westphal, B. N. Holben, C. Gueymard, I. McKendry,
N. Kuring, G. C. Feldman, C. McClain, R. J.
Frouin, J. Merrill, D. DuBois, F. Vignola, T.
Murayama, S. Nickovic, W. E. Wilson, K. Sassen,
N. Sugimoto
Paper revised for the JGR special issue on
dust The full paper is found at June 28, 2000
2
Summary
- On April 15 and 19 1998, two unusually intense
dust storms were generated over the Gobi Desert
by springtime cold weather systems. - The dust was detected and its evolution followed
by its distinctly yellow color on SeaWiFS
satellite images as well as through routine
surface-based monitoring and serendipitous
observations. - The April 19 dust cloud was transported across
the Pacific Ocean within 5 days and partially
subsided between British Columbia and California.
- On April 29, the average excess Asian dust
aerosol concentration over the West Coast was
about 20-50 mg/m3 with peak values gt 100 µg/m3..
- The dust volume mean diameter of was about 2-3
mm, increased the surface albedo over the
cloudless ocean and land by 10-20 but it
significantly reduced the cloud reflectance,
particularly near UV. - The Asian dust event was observed and interpreted
by an ad-hoc international web-based virtual
community of researchers.
3
Dust Pattern in the Gobi Desert and East Asia in
April 1998
- Daily measurements of surface visibility, aerosol
optical depth, TOMS data and SeaWiFS images for
the Gobi desert, show that major dust storms
occurred on April 15th and April 19th. - The April 19th storm had larger impact on the
East Asia region. - Model simulations of dust production and the dust
pattern correspond to the observations.
4
The April 15th Dust Storm Dissipation within
Asia
- SeaWiFS reflectance and TOMS absorbing aerosol
index data (green lines) for the April 15th dust
event. . - Fast winds ( gt 20 m/s) over the Gobi desert
generated individual dust plumes. - After about 500 km transport, the plumes merged
into a dust cloud
After 100o km transport from Gobi to Shanghai,
the yellow dust cloud has retained considerable
spatial texture. The April 15th dust was ingested
and removed by a precipitating low pressure
system. Yellow muddy rain was reported from
Beijing on April 16-17.
5
The April 19th Dust Storm
- SeaWiFS image of the April 19th dust storm. The
surface wind speed is gt 15-20 m/s and surface
visibility data indicate dust throughout
Mongolia. The yellow wedge-shaped dust cloud has
a clear front and is recorded in both the SeaWiFS
and TOMS data. The dust cloud over the Yellow See
is only present in the TOMS data
Size distribution data and inversions of optical
data show that the dust volume is in the 1-10 mm
size range with a peak at 2-3 mm
The dust layer increases the spectral reflectance
of soil, particularly at lgt0.6 mm.
6
April 20-21 Transport Across East Asia
- On April 20 the dust cloud was stretched along
the seaboard of East Asia - Dust layers over low level white clouds, turned
the clouds yellow by reducing the blue (412 nm)
reflectance up to a factor of two.
By April 21 the dust stretched 1000 km into the
Pacific. Over the dark ocean, the excess dust
reflectance was also yellow.
7
Trans-Pacific Dust Transport
Approximate location of the April 19th dust cloud
over the Pacific Ocean between April 21-25 based
on daily SeaWiFS, GOES 9/10 and TOMS data. Over
the Pacific Ocean, the dust cloud followed the
path of the springtime East-Asian aerosol plume
shown by the contours of optical thickness
derived from AVHRR data.
Throughout the Trans-Pacific transit, the dust
appeared as a yellow dye marking its own
position.
8
Lidar Dust Profiles Asian Dust over North America
- Lidar profile at Salt Lake City, UT on April 24
indicates a strongly scattering aerosol layer at
7-8 km with depolarization delta-values up to
18, indicating non-spherical dust particles.
- Lidar backscatter profiles at, Pasadena, CA at
the peak of the event (April 27) show a dust
layer between 6 and 10 km.
9
Visual Appearance of the Dust
- The most noticeable impact of the dust was the
discoloration of the sky. - From April 25 onward, the normally blue sky
appeared milky white throughout the non-urban
West Coast - This effect is due to the redistribution of the
direct solar radiation into diffuse skylight.
- Solar radiation data for Eugene, OR on a clear
and dusty day shows a loss of direct radiation
and doubling of the midday diffuse radiation due
to dust particle scattering and absorption.
10
Dust over the West Coast of North America
- a. GOES 10 geostationary satellite image of the
dust taken on the evening of April 27. - The dust cloud, marked by the brighter
reflectance covers the entire northwestern US and
adjacent portions of Canada. - A dust stream is also seen crossing the Rocky
Mountains toward the east.
b. Contour map of the PM10 concentration on April
29, 1998. Note the coincidence of high PM10 and
satellite reflectance over Washington
c. Regional average daily PM10 concentration over
the West Coast. The sharp peak on April 27-30 is
due to the Asian dust.
11
Dust Map over the West Coast
The PM2.5 dust concentration data from the
IMPROVE speciated aerosol network show virtually
no dust on April 25th, high values over the West
Coast on April 29th and dust further inland on
May 2. Evidently, on April 25th the dust layer
seen by the sun photometers was still elevated
since the surface dust concentration was low.
12
Hourly PM 10 Concentration in California
Hourly concentration data at 12 PM10 stations
near San Francisco shows that the dust has
subsided to the surface between April 26 and May
1. Note the the strong diurnal cycle during the
April 26-May 1 dust event.
13
The April 98 Asian dust - A unique Event over N.
America.
- The average PM2.5 dust concentration at three
IMPROVE monitoring sites over the 1988-98 period
was well below 1 mg/m3 - On April 29, 1998 the sites show simultaneous
sharp rise to 3-11 mg/m3. - Evidently, the April 1998 Asian dust event caused
2-3 times higher dust concentrations then any
other event during 1988-1998.
14
Conclusions - Recommendations
- Currently available space-borne and surface
aerosol monitoring allows the detection and
following the evolution of global-scale aerosol
events. - Additional activities may include (1) organizing
the available data into a documented and shared
resource base (2) global aerosol model validation
and testing (3) evaluation of satellite aerosol
retrievals. - The online data and explanations on the Asian
dust have provided just-in-time science support
to managers responsible for protecting public
health. - The Asian Dust web-based virtual community has
shown that ad-hoc collaboration is a practical
way to share observations and to collectively
generate the explanatory knowledge these major
but unpredictable atmospheric events. - A more robust and focused infrastructure to
supports such collaboration during extreme events
would assure that - learning is not left to chance!
Recommended
CrystalGraphics Presentations


