
Customizing Charts for Effective Data Representation in Presentations
Title:
Customizing Charts for Effective Data Representation in Presentations
Description:
To make two think-cell charts the same size, first select the first chart, note its dimensions from the formatting panel, and then apply those dimensions to the second chart. To activate think-cell in PowerPoint, open PowerPoint, go to the "Add-Ins" tab, and click the think-cell icon. To add lines to a chart, select it and use the “Insert” option to choose the line type. To switch between series in a chart, click on the series you want to view. If you need to show differences between data points, select the relevant points and use the "Difference" option from the context menu. This flexibility makes think-cell a valuable tool for creating and customizing charts in presentations, allowing users to enhance their visual data representation easily. –
Number of Views:0
Date added: 1 April 2025
Slides: 3
Provided by:
visualsculptors
Category:
How To, Education & Training
Tags:
Title: Customizing Charts for Effective Data Representation in Presentations
1
Think Cell Q A Tutorial
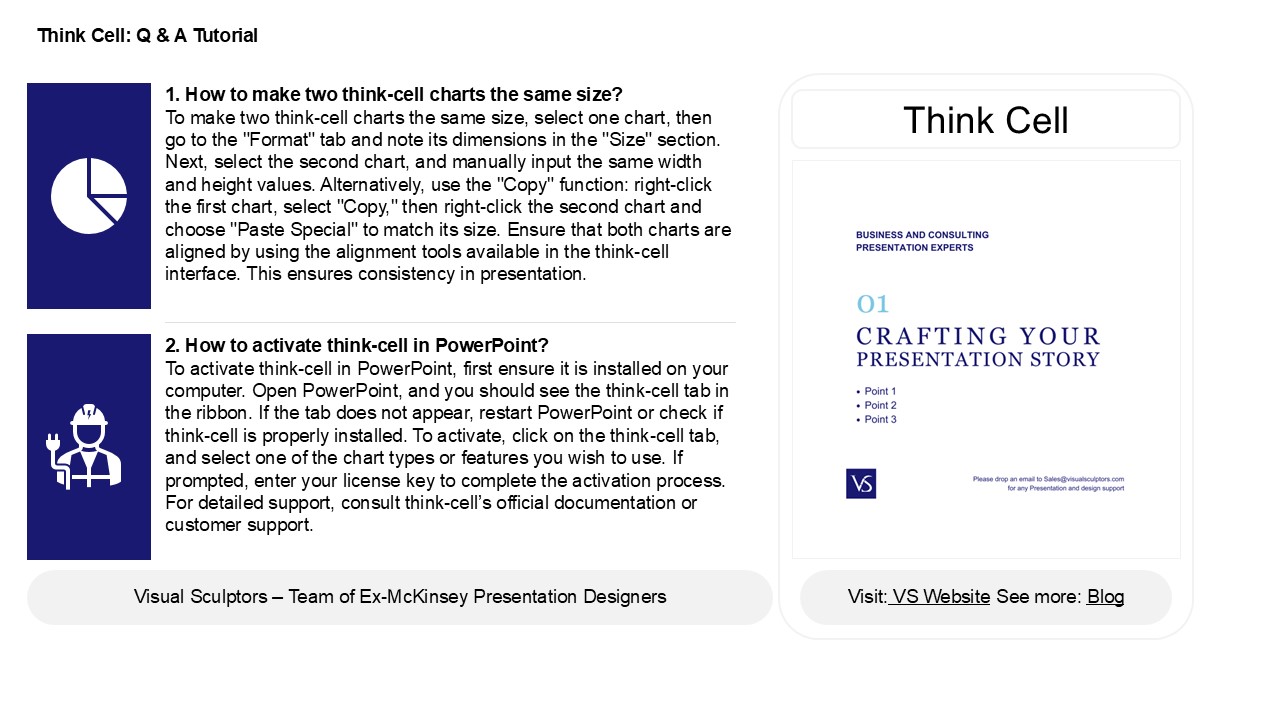
1. How to make two think-cell charts the same
size? To make two think-cell charts the same
size, select one chart, then go to the "Format"
tab and note its dimensions in the "Size"
section. Next, select the second chart, and
manually input the same width and height values.
Alternatively, use the "Copy" function
right-click the first chart, select "Copy," then
right-click the second chart and choose "Paste
Special" to match its size. Ensure that both
charts are aligned by using the alignment tools
available in the think-cell interface. This
ensures consistency in presentation.
Think Cell
2. How to activate think-cell in PowerPoint? To
activate think-cell in PowerPoint, first ensure
it is installed on your computer. Open
PowerPoint, and you should see the think-cell tab
in the ribbon. If the tab does not appear,
restart PowerPoint or check if think-cell is
properly installed. To activate, click on the
think-cell tab, and select one of the chart types
or features you wish to use. If prompted, enter
your license key to complete the activation
process. For detailed support, consult
think-cells official documentation or customer
support.
2
Think Cell Q A Tutorial
3. How do you add lines in think-cell? To add
lines in think-cell, first, select the chart or
slide where you want the line. Go to the
think-cell toolbar and choose the "Line" option.
Click on the chart or slide to place the line,
then drag to adjust its position and length. You
can customize the line's style and formatting by
right-clicking on it and selecting the
appropriate options. Additionally, you can
connect lines to data points or use them to
highlight specific areas within your chart for
better visualization.
4. How do I move to another series in
think-cell? To move to another series in
think-cell, first click on the chart to select
it. Then, use the keyboard arrow keys to navigate
through the series. Alternatively, you can click
on the desired series directly in the chart. If
you want to move between different series in the
data table, simply click on the respective cells
in think-cell's Excel-like interface. You can
also use the "Series" dropdown in the think-cell
toolbar to quickly switch between series.
5. How do you add a difference in think-cell? To
add a difference in think-cell, first ensure you
have a chart created. Click on the data table
associated with the chart, then locate the column
where you want to calculate the difference. You
can either enter a formula directly in the table
or use think-cells built-in functions. For
example, if you want to calculate the difference
between two values, type the formula (e.g.,
B2-C2 for values in columns B and C). Press
Enter, and the chart will automatically update to
reflect the new data.
Recommended
CrystalGraphics Presentations


