
Leveraging PowerPoint for Real-Time Data Updates: Building Waterfall Charts
Title:
Leveraging PowerPoint for Real-Time Data Updates: Building Waterfall Charts
Description:
To construct a waterfall chart in PowerPoint for effective data visualization, begin by identifying your initial value, which acts as the foundation of your analysis. Subsequently, incorporate columns to depict both increases and decreases in value, culminating in a distinctly labeled final total. You can utilize PowerPoint's integrated chart capabilities or import a chart from Excel, enabling real-time data synchronization. Furthermore, PowerPoint presents various data visualization alternatives, including funnel charts and flow diagrams, which are useful for illustrating processes and hierarchies. Leveraging these features will allow you to produce clear and insightful visual representations of your data. –
Number of Views:2
Date added: 25 February 2025
Slides: 3
Provided by:
visualsculptors
Category:
How To, Education & Training
Tags:
Title: Leveraging PowerPoint for Real-Time Data Updates: Building Waterfall Charts
1
Data Visualization Charts, Graphs and
Infographic designs - MS Graph Common Questions
Answered
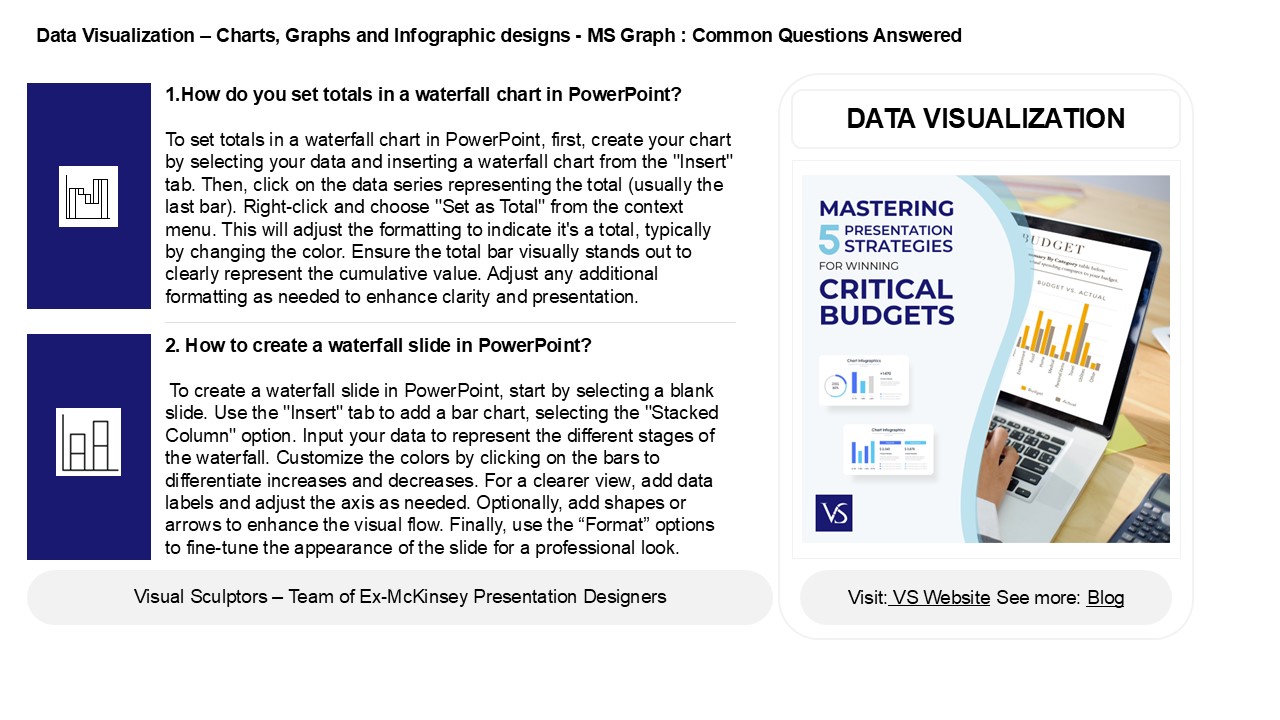
- 1.How do you set totals in a waterfall chart in
PowerPoint? - To set totals in a waterfall chart in PowerPoint,
first, create your chart by selecting your data
and inserting a waterfall chart from the "Insert"
tab. Then, click on the data series representing
the total (usually the last bar). Right-click and
choose "Set as Total" from the context menu. This
will adjust the formatting to indicate it's a
total, typically by changing the color. Ensure
the total bar visually stands out to clearly
represent the cumulative value. Adjust any
additional formatting as needed to enhance
clarity and presentation.
DATA VISUALIZATION
2. How to create a waterfall slide in PowerPoint?
To create a waterfall slide in PowerPoint,
start by selecting a blank slide. Use the
"Insert" tab to add a bar chart, selecting the
"Stacked Column" option. Input your data to
represent the different stages of the waterfall.
Customize the colors by clicking on the bars to
differentiate increases and decreases. For a
clearer view, add data labels and adjust the axis
as needed. Optionally, add shapes or arrows to
enhance the visual flow. Finally, use the
Format options to fine-tune the appearance of
the slide for a professional look.
2
Data Visualization Charts, Graphs and
Infographic designs - MS Graph Common Questions
Answered
3. How do I link a waterfall chart from Excel to
PowerPoint? To link a waterfall chart from
Excel to PowerPoint, first create your waterfall
chart in Excel. Select the chart, then copy it by
right-clicking and selecting "Copy" or pressing
CtrlC. In PowerPoint, go to the slide where you
want to place the chart, then right-click and
choose "Paste Special." Select "Paste Link" and
choose "Microsoft Excel Chart Object." This
creates a linked chart that updates automatically
if the Excel data changes. To refresh,
right-click the chart in PowerPoint and select
"Update Link.
4. How to make a funnel chart in PowerPoint? To
create a funnel chart in PowerPoint, follow these
steps 1. Open PowerPoint and select a blank
slide. 2. Go to the "Insert" tab and choose
"SmartArt." 3. In the SmartArt gallery, select
"Process" and choose a funnel-like layout (e.g.,
"Funnel"). 4. Click "OK" to insert it into your
slide. 5. Click on the shapes to enter your data,
adjusting the size of each section to represent
different values. 6. Customize colors and styles
using the "Design" and "Format" tabs as needed.
5. Is there a flow chart in PowerPoint? Yes,
PowerPoint has a feature for creating flow
charts. You can use the "SmartArt" tool, found
under the "Insert" tab, to select various flow
chart designs. Additionally, you can create flow
charts manually using shapes and connectors from
the "Shapes" menu. This allows for customization
of the flow chart to suit your specific needs.
Recommended
CrystalGraphics Presentations


