
Energy Blowing in the Wind - PowerPoint PPT Presentation
1 / 50
Title:
Energy Blowing in the Wind
Description:
Member States are required to adopt national targets for renewables that are ... Modern Multi-bladed water pumping HAWT. What's a modern wind turbine look like? ... – PowerPoint PPT presentation
Number of Views:88
Avg rating:3.0/5.0
Title: Energy Blowing in the Wind
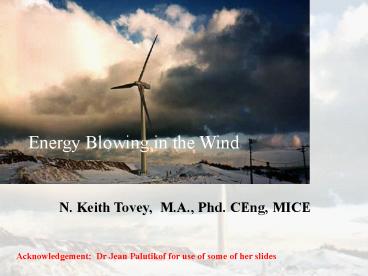
1
Energy Blowing in the Wind
N. Keith Tovey, M.A., Phd. CEng, MICE
Acknowledgement Dr Jean Palutikof for use of
some of her slides
2
The Energy Review 2002
- Renewables Target
- 10 by 2010 for Electricity Generation
- 20 by 2020
The European Commission directive 2001 Member
States are required to adopt national targets for
renewables that are consistent with reaching the
Commissions overall target of 12.1 per cent
electricity from renewables by 2010. UKs
indicative target is 10 per cent electricity.
3
Early Wind Power Devices
- C 700 AD in Persia
- used for grinding corn
- pumping water
- evidence suggests that dry valleys were Dammed
to harvest wind
4
Traditional Windmills
Traditional English Windmill
Spanish Windmills Note 7 in a cluster of 11
American Homestead Windmill for pumping water
5
Development of Modern Turbines
6
Vertical Axis Machines
7
Other Wind Machines
Savonius Rotors - good for pumping water - 3rd
World applications
8
Whats a modern wind turbine look like?
The Ecotech Turbine avoids having a high speed
gear box in the nacelle
Based on slide by Dr J. Palutikof
9
Ecotech wind turbine
- Electricity per annum 3.9 GWh
- Annual homes equivalent 938
- Displacement pa
- CO2 3000 tonnes
- SO2 39 tonnes
- NOx 3 tonnes
66m
67m
Dr J. Palutikof
10
Energy Scenarios for UK and implications on CO2
emissions.
We could make CO2 targets with all new
electricity generation from gas, but then 75
of our electricity will depend on supplies of gas
from Russia, Middle East, or North Africa
These figures assume we achieve 20 renewable
generation by 2022
11
Options for Electricity Generation in 2020 -
Non-Renewable Methods
12
Options for Electricity Generation in 2020 -
Renewable
13
Renewable Energy comparisons
In the home - on average 25 - 40 sq m of
PhotoVoltaic Cells would provide the equivalent
of the electricity requirements of the house
14
Distribution of Renewable Projects
15
The UK target for New Renewables set in 1993, was
the building of 1500MW of new renewable capacity
by 2000. How did we do?
16
Wind Energy in UK (end of 2001)
Million Tonnes Carbon Dioxide Sulphur
Dioxide Oxides of Nitrogen
17
Increase in Renewable Component for Electricity
Generation to meet Government Target of 10 by
2010
Note If we meet this target, it will hardly
change the non-renewable component - i.e. the
renewable deployment will just keep pace with
increase in demand.
Even if we do meet target (which is far from
certain), our CO2 emissions will rise following
from closure of nuclear plant.
18
National Demand for Electricity also changes
rapidly
Prices paid by Suppliers vary dramatically over
the day The introduction of NETA on 27th March
2001 had an adverse effect on economics of
Renewable Energy and CHP
19
How are we going to meet these demands for
electricity in the future? The Energy Review
indicates 10 by renewables by 2010 and 20 by
2020.
In order to get more than 10 of electricity
from renewables by 2010 and 20 by 2020, build
rates for the leading options would need to be at
levels never before seen in the UK. Onshore and
offshore wind would need to be installed at a
rate of between 1-2 GW per year (i.e. 1000 -
1500 turbines the size of Swaffham every year).
However, 1.5 GW and 1.6 GW of onshore wind was
built in Germany in 1999 and 2000 respectively,
and a further 1.2 GW was installed in the first
eight months of this year (2001). Build rates of
1 GW per year were also seen Spain in 2000, and
600MW in Denmark in the same year.
20
Wind Energy in Europe
Overall EU target of 12 of energy (22
electricity) from renewables by 2010 - UK 10
Currently 13,000 MW from wind energy
21
Onshore Wind Turbines in Denmark
22
Wind Map of Western Europe wind resource at
50m above surface
Sheltered Open
Coast Open sea Hills
Dr J. Palutikof
23
Wind map of UK
- The detailed picture is much more complex
- Topography
- Distance from sea
- Roughness
- Obstacles
Dr J. Palutikof
24
Power in the wind
- Kinetic Energy in Wind
- where ? air density
- R blade radius
- V Wind Velocity.
- Because wind cannot come to standstill, only
59.26 is actually available - The Betz Efficiency
25
(No Transcript)
26
Annual output depends of wind speed distribution
- Using a typical Wind Speed distribution gives a
load factor of around 30 - 70 - 80 for fossil fuel stations and nuclear.
- Actual load factor does depend on
- Wind Speed Distribution Curve
- Turbine Rating Curve
Prevailing Wind direction can vary significantly
as shown by the two rosette plots from stations
150 km apart.
27
Obstructions can affect output for significant
distances downwind.
Effect of a forest of trees 20 m tall on output
from turbine. At a hub height of 2.5 times trees
and 15 tree heights downwind, 16 of energy is
lost.
Image obtained from www.windpower.org
28
Wind Speed variation with elevation above ground
The wind speed increases logarithmically with
elevation.
Depends on roughness of terrain
Increasing hub height increases power by 10.
29
Spacing of Wind Turbines
- Interference between adjacent turbines occurs if
spacing is less than 7 - 10 blade diameters -
The Park Effect. - With large arrays, 10 - 20 reduction in output
will occur with a spacings of 5 blade
diameters. - Because of square law of swept area, and larger
turbines requiring greater spacing, the
effective harvest of the wind is approximately
the same irrespective of turbine size. - However, costs will come down with fewer larger
machines.
30
Wind Turbine Locations
31
Key Environmental Issues - some of main issues
against
- Distraction to drivers
- Danger to birds
- Radio/Television/Radar Interference
- Noise - mechanical, aerodynamic, ..infra-sound?
- Flickering
- - only relevant within buildings and then only in
a precise orientation at selected times of the
year. - Danger of ice throw
- - not really a problem as other constraints will
mean that a sufficient exclusion zone is present
anyway - Blade failure
- Aesthetics -
- one blade, two blades, three blades, Darrieus,
Musgrove?
32
Ice can form but if this occurs when stationary,
the machine will not start if it forms in
operation, then the out of balance on blades is
detected and the machine will stop in a few
revolutions. Worse case scenario would cause ice
to be thrown distances much less than the
exclusion zone for noise.
33
Noise issues
In Denmark, a noise limit of 45 dB is set for
isolated houses or 40 dB where several houses are
affected.
Two turbines close together would increase noise
by about 3dB, while increase for 10 would be 10 dB
34
Rule of thumb for noise
- EuropeDistance to houses should be gt 7 rotor
diameters or 300 m 1000 ft. - USA
Dr J. Palutikof
35
Noise Contours for a cluster of three turbines at
Shipdham
Noise issues Mechanical Aerodynamic Infra-so
und
Problem with high-speed gearboxes in fixed
velocity machines. Not an issue with Swaffham/
proposed turbines at Shipdham. Maximum rotation
speeds of gearboxless turbines are at a maximum
70 of normal wind turbines, and often much less
- hence much less swish noise. This is a
subject which is not fully understood - it is at
a frequency which would NOT be detected by normal
ground vibration.
gt 30 dB gt 40 dB gt 50 dB
36
One Blade, or Two, or Three?
37
Visual intrusionSome designs look better than
others
38
.. and some arrays look better than others
Dr J. Palutikof
39
Managing Environmental Issues
- Safety Issues
- Visual Issues
- Noise Issues
- Bird Strikes
- TV/Radio Interference
First three can be managed using GIS procedures.
Exclusion zones can be drawn for each feature
type.
40
A Strategic assessment of Wind Energy / Biomass
Potential
Digital Map of part of Norfolk Norwich is in
bottom left hand corner Area 105 sq kms
41
Minimum exclusion zone (400m) around houses/towns.
Number of Turbines 65 Mean output 24.4 MW Area
for Turbines 20.7 sq km
We could add other Planning exclusions etc -
areas of particular landscape value etc.
42
Large exclusion zone (800m) around houses/towns.
Number of Turbines 33 Mean output 12.4 MW Area
for Turbines 10.2 sq km
43
Key Environmental Issues of Wind Energy -
positive aspects
Offsets the use of fossil fuels and
consequential gaseous emissions of CO2, SO2,
NOx, CO, NMHC etc. Arguements that fossil
fuel power stations have to be kept ready in case
wind drops are completely INVALID. Power
stations running under lower load use less fuel
and it is this which causes the
emissions. Improves diversity of supply of
electricity will become of increasing importance
in future Is becoming technically mature unlike
most other renewable technologies (other than
energy from waste incineration and hydro) Is the
most cost effective Renewable Option currently
available, and will remain so for next decade
As electricity will used locally, reduces
transmission losses.
44
Offshore wind energy - A solution?
BUT Wind speeds are high Resource is
enormous Visual intrusion is less than for onshore
- Its expensive
- Maintenance is problematic
45
Test location for offshore Wind Turbines in
Denmark
46
Existing European offshore wind farms
Dr J. Palutikof
47
How much energy?
48
Size of the resource
From BWEA Web Site
- This is based on 1999 consumption figures and is
a little optimistic with regard to spacing of
turbines - a more realistic figure is given by
40km x 40km
49
Examples of Offshore Wind
50
Conclusions
- Wind Energy has matured in the last decade.
- Significant developments are Wind Energy are
likely in next decade both onshore and offshore
if UK is to meet its targets. - However, planning issues may continue to hinder
development. In decade to 2000, 1100 MW were
proposed, but less than 200 MW were built. - We need to manage it to our benefit.
When questioned, typically 70 - 80 of the
public are in favour of Wind Energy, but the
opponents are very vociferous.
Recommended
CrystalGraphics Presentations


