Computer Graphics Introduction - PowerPoint PPT Presentation
1 / 61
Title:
Computer Graphics Introduction
Description:
Computer Graphics - Introduction ... in computer technology have made interactive computer graphics a practical ... major use of computer graphics is in design ... – PowerPoint PPT presentation
Number of Views:520
Avg rating:3.0/5.0
Title: Computer Graphics Introduction
1
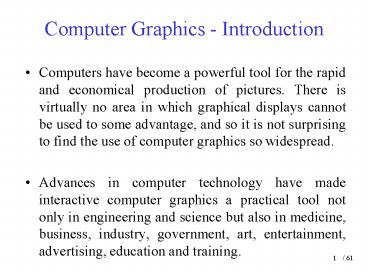
Computer Graphics - Introduction
- Computers have become a powerful tool for the
rapid and economical production of pictures.
There is virtually no area in which graphical
displays cannot be used to some advantage, and so
it is not surprising to find the use of computer
graphics so widespread. - Advances in computer technology have made
interactive computer graphics a practical tool
not only in engineering and science but also in
medicine, business, industry, government, art,
entertainment, advertising, education and
training.
2
Computer Aided Design (CAD)
- A major use of computer graphics is in design
processes, particularly for engineering and
architectural systems, but almost all products
are now computer designed. - CAD methods are now routinely used in the design
of buildings, automobiles, aircraft, watercraft,
spacecraft, computers, textiles, and many other
products.
3
- For some design applications, objects are first
displayed in a wireframe outline, form that shows
the overall shape and internal features of
objects. - Wireframe displays also allow designers to
quickly see the effects of interactive
adjustments to design shapes.
4
(No Transcript)
5
(No Transcript)
6
- CAD Applications provide the designer with a
multi-window environment.
7
- Logical circuits and electrical circuits are
constructed with repeated placement of a few
graphical shapes. - For other applications, a designer can create
personalized symbols that are to be used to
construct the network or circuit. - Animations are often used in CAD applications,
which is very useful for testing performance of a
vehicle or system.
8
- The tractor operator manipulates the controls,
the headset presents a stereoscopic view of the
front-loader bucket or the backhoe, just as if
the operator were in the tractor seat.
9
(No Transcript)
10
- This allows the designer to explore various
positions of the bucket or backhoe that might
obstruct the operators view, which can then be
taken into account in the overall tractor design.
11
- When object designs are complete realistic
lighting models and surface rendering are applied
to produce displays that will show the appearance
of the final product. - Numerically controlled machine tools are than set
up to manufacture the part according to these
construction layouts.
12
- Architects use interactive graphics methods to
lay out floor plans that show the positioning of
rooms, doors, windows, stairs, shelves counters
and other building features. - Realistic displays of architectural designs
permit both architects and their clients to study
the appearance of a single building or a group of
buildings, such as a campus or industrial
complex.
13
- With virtual reality systems, designers can even
go for a simulated walk through the rooms or
around the outsides of buildings to better
appreciate the overall effect of a particular
design. - Many other kinds of systems and products are
designed using either general CAD packages or
specially developed CAD software, for example a
rug pattern can be designed with a CAD systems.
14
Presentation Graphics
- This is another major application area, used to
produce illustrations for reports or to generate
transparencies for use with projectors. - It is commonly used to summarize financial,
statistical, mathematical, scientific and
economic data for research reports, managerial
reports, consumer information bulletins, and
other types of reports. - Examples Bar charts, line graphs, surface
graphs, pie charts, ..., etc.
15
Computer Art
- Computer graphics methods are widely used in both
fine art and commercial art applications. - The picture is usually painted electronically on
a graphics tablet (digitizer) using a
pressure-sensitive-stylus, which can simulate
different brush strokes, brush widths and colors. - The next 4 figures show examples of mathematical
art, which is a combination of mathematical
functions, fractal procedures, mathematical
software, ink-jet printers, and other systems to
create a variety of 3D and 2D shapes and
stereoscopic image pairs.
16
(No Transcript)
17
(No Transcript)
18
(No Transcript)
19
(No Transcript)
20
- These methods are applied for generating
electronic images in the fine arts and also in
commercial art for logos and other designs, page
layouts combining text and graphics, TV
advertising spots and other areas. - Animations are also used frequently in
advertising and televisions commercials are
produced frame by frame, where each frame of the
motion is rendered and saved as an image file. In
each successive frame, the motion is simulated by
moving object positions slightly from their
positions in the previous frame.
21
- Film animations require 24 frames for each second
in the animation sequence. If the animation is to
be played back on a video monitor, 30 frames per
second are required. - A common graphics method employed in many
commercials is morphing, where one object is
transformed (metamorphosed) into another. This
method has been used in TV commercials to turn an
oil can into an automobile engine, an automobile
into a tiger, a puddle of water into a tire and
one persons face into another face.
22
(No Transcript)
23
Entertainment
- Many TV series regularly employ computer graphics
methods. Graphics objects can be combined with
the live action. - Image processing techniques can be used to
produce a transformation of one person or object
into another (morphing).
24
Education and Training
- Computer-generated models of physical, financial
and economics systems are often used as
educational aids. - Models of physical systems, physiological
systems, population trends or equipment can help
trainees to understand the operation of the
system. - Simulation see the next figures.
25
(No Transcript)
26
(No Transcript)
27
(No Transcript)
28
(No Transcript)
29
(No Transcript)
30
(No Transcript)
31
(No Transcript)
32
(No Transcript)
33
Visualization
- Scientist, engineers, medical personnel, business
analysts and others often need to analyze large
amounts of information or to study the behavior
of certain processes. - Numerical simulations carried out on
supercomputers frequently produce data files
containing thousands and even millions of data
values. - But if the data are converted to a visual form,
the trends and patterns are often immediately
apparent.
34
- Next figure shows an example of a large data set
that has been converted to a color coded display
of relative heights above a ground plane. Once we
have plotted the density values in this way, we
can see easily the overall pattern of the data.
Producing graphical representations for
scientific, engineering and medical data sets and
processes is generally referred to as scientific
visualization. And the term business
visualization is used in connection with data
sets related to commerce, industry and other
nonscientific areas.
35
(No Transcript)
36
- Additional techniques include contour plots,
graphs and charts, surface renderings, and
visualizations of volume interiors. In addition,
image processing techniques are combined with
computer graphics to produce many of the data
visualizations. - Mathematicians, Physical scientists and others
use visual techniques to analyze mathematical
functions and processes or simply to produce
interesting graphical representations.
37
(No Transcript)
38
(No Transcript)
39
(No Transcript)
40
(No Transcript)
41
(No Transcript)
42
(No Transcript)
43
(No Transcript)
44
(No Transcript)
45
(No Transcript)
46
(No Transcript)
47
(No Transcript)
48
(No Transcript)
49
Image Processing
- Although, methods used in computer graphics and
image processing overlap, the two areas are
concerned with fundamentally different
operations. - In computer graphics, a computer is used to
create a picture. - Image processing applies techniques to modify or
interpret existing pictures, such as photographs
and TV scans.
50
- Tow principal applications of image processing
are - improving picture quality
- machine perception of visual information as used
in robotics. - To apply image processing methods, we first
digitize a photograph or other picture into image
file. Then digital methods can be applied to
rearrange picture parts, to enhance color
separations, or to improve the quality of
shading. - These techniques are used extensively in
commercial art applications that involve the
retouching and rearranging of sections of
photographs and other artwork. Similar methods
are used to analyze satellite photos of the earth
and photos of galaxies.
51
(No Transcript)
52
- Medical Application also make extensive used of
image processing techniques for picture
enhancements, in tomography and in simulations of
operations. - Tomography is a technique of X-ray photography
that allows cross-sections views of physiological
systems to be displayed. X-ray tomography uses
projection methods to reconstruct cross section
from digital data. - These techniques are also used to monitor
internal functions and show cross sections during
surgery.
53
- Other medical imaging techniques include
ultrasonic and nuclear medical scanners. With
ultrasonics, high-frequency sound waves, instead
of X-rays, are used to generate digital data.
Nuclear medicine scanners collect digital data
from radiation and plot color-coded images. - Medicine used these techniques to model and study
physical functions, to design artificial limbs,
and to plan and practice surgery. The last
application is generally referred to as computer
aided surgery. 2D cross sections of the body are
obtained using imaging techniques. Then the
slices are viewed and manipulated using graphics
methods to simulate actual surgical procedures
and to try out different surgical cuts.
54
(No Transcript)
55
Image Processing
?
Image Recognition Security Systems Image
Enhancement Satellite Images Image Synthesis
Identification Systems Image Reconstruction
Plastic Surgery Design Systems
involves
56
- Algorithms of Image Processing
- Compression Decompression
- Object Recognition
- Comparing Images with Predefined Objects
- Image Enhancement
- Grey Scale Balancing
- Grey Scale and Color Adjustments
- Image processing may combine the technologies of
full-motion video with images.
57
Image Enhancement
- Image Calibration the overall image density is
calibrated, and the image pixels are adjusted to
a predefined level. - Real-Time Alignment The image is aligned
(rotated by small angels) in real-time for
skewing caused by improper feeding of paper. - Gray-Scale Normalization The overall gray level
of an image is evaluated to determine of it is
skewed in one direction and if it needs
correction.
58
- RGB Hue Intensity Adjustment Too much color
makes a picture garish and fuzzy. Automatic hue
intensity adjustment brings the hue intensity
within predefined ranges. - Color Separation A picture with very little
color contrast can be dull and may not bring out
the detail. The hardware used can detect and
adjust the range of color separation. - Frame Averaging The intensity level of the frame
is averaged to overcome the effects of very dark
or very light areas by adjusting the middle tones.
59
- Non-Textual Image Recognition
- In character recognition the system should be
able to distinguish between textual and
non-textual objects. There are two kinds here
still image recognition and video recognition
which is more complicated but very important in
robotics applications. - These are some applications of image recognition
- Medicine
- Manufacturing
- Security Systems
- Robotics
60
- Image recognition requires collecting and
analyzing a very large volume of data very
rapidly. More important, it requires connecting
various types of data that otherwise seem to have
no relationship. While the human brain has
mastered the ability to absorb such vast amounts
of detailed information and instantly relate
parts of it or interpret the relationship to new
situations, this task is very complex for
computer. The human brain has the ability to
gauge the thoughts and emotions of a person
simply by looking at one, instantaneously and
smoothly. The amount of data processed by the
brain is large. However the brain uses shortcuts
in reaching those conclusions. - We always need to know the latest hypothesis and
theories of how the brain works since we are
trying to give the computer the ability of
resembling the human brain in all tasks.
61
Graphical User Interface (GUI)
- A major component of a GUI is a window manager
that allows a user to display multiple window
areas. Each window can contain a different
process that contain graphical or non-graphical
displays. - An icon is a graphical symbol that is designed to
look like the processing option it represents.
Recommended
CrystalGraphics Presentations