ArcGIS 3D Analyst - PowerPoint PPT Presentation
1 / 26
Title:
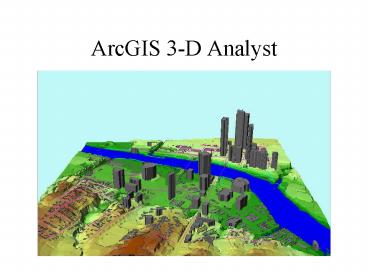
ArcGIS 3D Analyst
Description:
UT Football. Stadium. A Portion of the TIN. Input Data for this Portion. Mass Points ... Source: Roberto Gutierrez, UT Bureau of Economic Geology. Interpolation ... – PowerPoint PPT presentation
Number of Views:228
Avg rating:3.0/5.0
Title: ArcGIS 3D Analyst
1
ArcGIS 3-D Analyst
2
Triangulated Irregular Network (TIN)
3
A Mesh of Triangles
Triangle is the only polygon that is always
planar in 3-D
Lines
Surfaces
Points
4
Tin Triangles in 3-D
(x3, y3, z3)
(x1, y1, z1)
(x2, y2, z2)
z
y
Projection in (x,y) plane
x
5
Delauney Triangulation
Maximize the minimum interior angle of
triangles No point lies within the circumcircle
of a triangle
Yes
No
6
Circumcircle of Triangle
- Draw the perpendicular bisectors of each edge of
the triangle - Circumcircle is centered on their intersection
point - Radial lines from center have equal length
7
Inputs for Creating a TIN
- Hard breaklines define locations of abrupt
surface change (e.g. streams, ridges, road kerbs,
building footprints, dams) - Soft breaklines are used to ensure that known z
values along a linear feature are maintained in
the tin.
8
TIN for Waller Creek
9
TIN with Surface Features
Classroom
UT Football Stadium
Waller Creek
10
A Portion of the TIN
11
Input Data for this Portion
Mass Points
Soft Breaklines
Hard Breaklines
12
TIN Vertices and Triangles
13
TIN Surface Model
Waller Creek
Street and Bridge
14
3-D Scene
15
3-D Scene with Buildings
16
LIDAR Terrain Surface for Powder River, Wyoming
Source Roberto Gutierrez, UT Bureau of Economic
Geology
17
Interpolation using Rasters
- Interpolation in Spatial Analyst
- Inverse distance weighting
- Spline
- Kriging
- Interpolation in Geostatistical Analyst
18
Interpoloation using Kriging
Kriging weights
19
SemiVariagram
h separation distance between i an j
20
Fecal Coliform Levels in Galveston Bay
21
Normal Q-Q plot
22
2D Trend Analysis
23
Defining the Semivariogram
24
Cross Validation
25
Predicted Fecal Coliform Concentration
26
Average in each Bay


