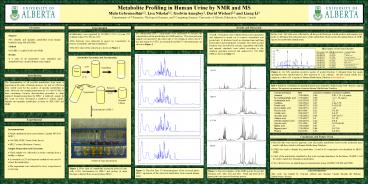
Overview - PowerPoint PPT Presentation
1 / 1
Title: Overview
1
Metabolite Profiling in Human Urine by NMR and
MS Mulu Gebremedhin1,2, Lisa Nikolai1,2, Godwin
Amegbey2, David Wishart2,3 and Liang
Li1 Departments of 1Chemistry, 2Biological
Sciences, and 3Computing Science, University of
Alberta, Edmonton, Alberta, Canada
Overview
Results and Discussion
Experimental
Six independent HPLC experiments were performed
to increase the concentration of the metabolites
for NMR analysis. The extracted urine sample was
injected (5 mL each) onto a C18 column at a flow
rate of 5 mL/min using 0.1 TFA in acetonitrile
and the UV-chromatograms are shown in Figure 2.
In this work , MS data were collected for all the
pooled fractions at both positive and negative
ion mode to determine the molecular mass of the
metabolites which assists the interpretation of
NMR spectra for metabolite identification.
- ? Metabolites were separated by 1D HPLC (250 x 10
mm C18 column) using 0.1 TFA in ACN - The fractions were subjected to speed vac
concentrator to remove acetonitrile and then
lyophilized. - The flow chart of the extraction is shown in
Figure 1
Overall, 70 fractions were collected from each
experiment and subjected to speed vac to remove
acetonitrile and pooled into 13 fractions based
on retention time and then freeze-dried and
lyophilized overnight. The dried pooled fractions
were dissolved in solvents compatible with NMR
and internal standards were added according to
the standard operating protocol and analyzed by
500 MHz NMR as shown in Figure 3.
- Purpose
- To identify and quantify metabolites from human
biofluids using MS and NMR - Method
- 1D-HPLC coupled to MS and NMR
- Results
- ? A total of 48 metabolites were identified and
quantified from a normal human urine sample
(B) Example of MS Search Results
Metabolite Extraction and Fractionation
ACN
Centrifuge
Urine
Figure 4. (A) MS spectrum (positive mode) of
pooled fraction 2 obtained from the single
quadrupole mass spectrometer by flow injection of
2 ?L solution. (B) MS search results for a
single m/z value (136.1) against a Human
Metabolome Database ( www.hmdb.ca)
Introduction
(11)
The determination of all possible metabolites
from urine is important in the study of human
diseases. GC and GC-MS have been widely used for
the analysis of specific metabolites in urine.
However, the sample preparation for GC and GC-MS
is time consuming, because derivatization
procedure is often required. Sample preparation
for HPLC is relatively simple. In this work we
have developed a method to isolate, purify,
identify and quantify metabolites in urine by
HPLC-MS and NMR.
Table I. Partial list of identified and
quantified human urine metabolites obtained using
NMR Chenomx eclipsed software. The reported
concentration is from the Human Metabolome
Database
Remove
Supernatant
ACN
(B) P3
Original volume
Fractionation by HPLC
(C ) P4
Experimental
- Instrumentation
- Single quadrupole mass spectrometer (Agilent HP
1100 MSD ) - 500 MHz NMR (Varian Unity Inova)
- HPLC system (Beckman Courier)
- Sample Preparation and Extraction
- Urine sample was collected in a sterile
container from a healthy volunteer - Acetonitrile (ACN) and aqueous methanol were
used to extract the metabolites - The supernatant were subjected to rotary
evaporation at room temp.
Conclusions and Future Work
- The MS data were used to generate a list of
possible metabolites based on the molecular mass
match with those listed in a Human Metabolome
Database. - NMR was used to identify the metabolites. A
total of 48 compounds were identified by
HPLC-NMR. - Most of the metabolites identified in this work
are high abundance. In the future, 2D-HPLC will
be used to enrich low abundance metabolites. - We will also focus on identifying novel
metabolites using 2D-HPLC-FT-MS and NMR.
(D) P5
Pictures of some urine fractions
Figure 1. Flow chart of metabolite extraction
protocol (only with ACN), fractionation by HPLC
and picture of urine fractions collected from
reversed phase HPLC.
Figure 2. The first four UV-chromatograms of the
reversed phase HPLC separation of the extracted
metabolites from normal human urine.
Figure 3. Typical examples of the NMR spectra for
pooled fractions 2(A), 3(B), 4(C) and 5(D).
Water and DSS (at 0.0 ppm) peaks are removed from
the spectra.
Acknowledgements
This work was funded by Genome Alberta and Genome
Canada through the Human Metabolomics Project.


