
Put Your Title Here - PowerPoint PPT Presentation
1 / 1
Title:
Put Your Title Here
Description:
... occupies more than 90% of the ORT when a GRIS doesn't cache data. ... The Client-Connect time, which occupies 95% of ORT, is the performance constraint. ... – PowerPoint PPT presentation
Number of Views:93
Avg rating:3.0/5.0
Title: Put Your Title Here
1
Performance Analysis of the Globus Toolkit
Monitoring and Discovery Service, MDS2
Monitoring and information services form a key
component of a distributed system, or Grid. A
quantitative study of such services can aid in
understanding the performance limitations, advise
in the deployment of the monitoring system, and
help evaluate future development work. To this
end, we examined the performance of the Globus
Toolkit Monitoring and Discovery Service (MDS2)
by instrumenting its main services using
NetLogger. Our study shows a strong advantage to
caching or prefetching the data, as well as the
need to have primary components at well-connected
sites.
Approach We examined the behaviors of the
Globus Toolkit Monitoring and Discovery Service
(MDS2) under a variety of configurations at a
fine granularity. Not like our previous study by
focusing on analyzing the end-to-end performance
of a user request, we evaluated the performance
of each subphase in order to better understand
the performance constraints of the system.
Specifically, we ran a set of experiments to
evaluate the effect of a large number of
concurrent users accessing different services
provided by MDS2 by using NetLogger technologies
to instrument both MDS2 server and client
codes. NetLogger Instrumentation We use
NetLogger to instrument MDS2. NetLogger is a
toolkit developed by Lawrence Berkley National
Laboratory to monitor the behavior of elements of
a distributed system in order to determine
exactly where time is spent within such a system
and identify the performance bottlenecks. With
NetLogger, the components of a distributed system
can be modified to produce time-stamped logs of
"interesting" events at all the critical points,
which are then correlated to allow the
characterization of the performance of all
aspects of the system in detail. We inserted
the NetLogger API calls at all the critical
points in both MDS2 server and client codes and
broke the end-to-end path of a MDS2 request into
seven phases (1) Client-Connect, (2)
Client-Bind, (3) Server-InitSearch, (4)
Server-SearchIndex, (5) Server-Invoking, (6)
Server-GenResult, and (7) Client-EndConnect.
Phases 1, 2, and 7 constitute the MDS2 client
side components, and phases 3-6 constitute the
server-side components. Figure 1 presents a
NetLogger view of the behavior of a MDS v2.4 GRIS
without data caching accessed by 10 concurrent
users.
Our experiments address two MDS2 performance
topics (1) the scalability of MDS2 information
server (GRIS) with a large number of concurrent
users, (2) the scalability of MDS2 directory
server with concurrent users. We examined two
different scenarios in (1), the GRIS always
caching the data from the information providers
and the GRIS never caching the data, to help
estimate the performance of the average case,
which is somewhere between these two . In (2), we
configured MDS2 GIIS to always cache the data
since we analyze only the directory functionality
of the GIIS.
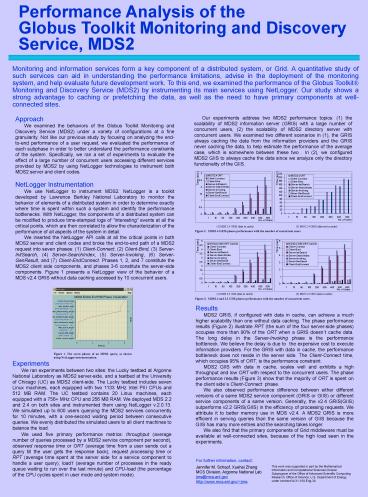
Results MDS2 GRIS, if configured with data in
cache, can achieve a much higher scalability than
one without data caching. The phase performance
results (Figure 2) illustrate RPT (the sum of the
four server-side phases) occupies more than 90
of the ORT when a GRIS doesnt cache data. The
long delay in the Server-Invoking phase is the
performance bottleneck. We believe the delay is
due to the expensive cost to execute information
providers. For the GRIS with data in cache, the
performance bottleneck does not reside in the
server side. The Client-Connect time, which
occupies 95 of ORT, is the performance
constraint. MDS2 GIIS with data in cache, scales
well and exhibits a high throughput and low ORT
with respect to the concurrent users. The phase
performance results (Figure 3) show that the
majority of ORT is spent on the client sides
Client-Connect phase. We also observed
performance difference between either different
versions of a same MDS2 service component (GRIS
or GIIS) or different service components of a
same version. Generally, the v2.4 GRIS(GIIS)
outperforms v2.2 GRIS(GIIS) in the efficiency of
processing requests. We attribute it to better
memory use in MDS v2.4. A MDS2 GRIS is more
efficient in serving queries than the same
version of GIIS because the GIIS has many more
entries and the searching takes longer. We also
find that the primary components of Grid
middleware must be available at well-connected
sites, because of the high load seen in the
experiments.
Experiments We ran experiments between two
sites the Lucky testbed at Argonne National
Laboratory as MDS2 server-side, and a testbed at
the University of Chicago (UC) as MDS2
client-side. The Lucky testbed includes seven
Linux machines, each equipped with two 1133 MHz
Intel PIII CPUs and 512 MB RAM. The UC testbed
contains 20 Linux machines, each equipped with a
756 MHz CPU and 256 MB RAM. We deployed MDS 2.2
and 2.4 on both sites and instrumented them using
NetLogger v.2.0.13. We simulated up to 600 users
querying the MDS2 services concurrently for 10
minutes, with a one-second waiting period between
consecutive queries. We evenly distributed the
simulated users to all client machines to balance
the load. We used five primary performance
metrics throughput (average number of queries
processed by a MDS2 service component per
second), observed response time or ORT (average
time from a user sends out a query till the user
gets the response back), request processing time
or RPT (average time spent at the server side for
a service component to handle a user query),
load1 (average number of processes in the ready
queue waiting to run over the last minute) and
CPU-load (the percentage of the CPU cycles spent
in user mode and system mode).
This work was supported in part by the
Mathematical Information and Computational
Sciences Division Subprogram of the Office of
Advanced Scientific Computing Research, Office of
Science, U.S. Department of Energy, under
contract W-31-109-Eng-38.
Recommended
CrystalGraphics Presentations


