
Quartile PowerPoint PPT Presentations
All Time
Recommended

DEC 2018 NMIMS Solved Assignments, NMIMS DEC Assignments, NMIMS Ready DEC Assignments, NMIMS 2018 DEC Assignments, NMIMS Customized 2018 DEC Assignments, NMIMS Unique Assignments, NMIMS Best 2018 Assignments. www.answersheets.in info.answersheets@gmail.com info@answersheets.in +91 95030-94040
| PowerPoint PPT presentation | free to download

Title: Medians, Quartiles and Box Plots Last modified by: Abe Created Date: 12/2/2003 7:58:35 PM Document presentation format: On-screen Show Company
| PowerPoint PPT presentation | free to download

fences bound all the data except for outliers. The Interquartile Range ... Upper fence is the largest data value that is not an outlier. Interpret the Boxplot ...
| PowerPoint PPT presentation | free to view

Remember: The range is the measure of spread that goes with the mean. ... Anatomy of a Box and Whisker Diagram. Lower Quartile = 5. Q1. Upper Quartile = 9. Q3 ...
| PowerPoint PPT presentation | free to view

Median, Quartiles, InterQuartile Range and Box Plots'
| PowerPoint PPT presentation | free to view

Remember: The range is the measure of spread that goes with the mean. ... Question: Gemma recorded the heights in cm of girls in the same class and ...
| PowerPoint PPT presentation | free to view

0-12 Mean, Median, Mode, Range and Quartiles Objective: Calculate the measures of central tendency of a set of data. Measures of Central Tendency Numbers used to ...
| PowerPoint PPT presentation | free to view

Use left navigation to select desired page... Click on save icon in the new window. Notice that hovers DO NOT appear in saved file ...
| PowerPoint PPT presentation | free to view

... Imperative data, probability, statistics and competent problem solvers. ... in the story and gods and goddesses in the story and designs a crossword puzzle. ...
| PowerPoint PPT presentation | free to view
Data Basics The following list of s from Andrew Moore Measures of Dispersion (Inter-Quartile Range) Inter-Quartile Range (IQR): More robust Sample IQR: Measures ...
| PowerPoint PPT presentation | free to download

4-8 BOX-AND-WHISKER PLOTS. Define. Range. Lower quartile. Upper quartile. Interquartile range. Outlier. B. Box-and-whisker plot ...
| PowerPoint PPT presentation | free to view

Kurtosis. Peaked. Skewness. Skew. Range (max-min), Interquartile range (1st-3rd quartile) ... In descriptive statistics, a quartile is any of the three values ...
| PowerPoint PPT presentation | free to view
Quantile Functions. Statistical Expectation. Quantiles. median, quartiles, ... 'approx. quantile unbiased' Weibull plotting-positions (a=0) F(x) = i/(n 1) ...
| PowerPoint PPT presentation | free to download

11.2B Box-and Whisker Plots Objectives To get a more complete picture of the data. Be able to figure out the first quartile, third quartile, and interquartile range.
| PowerPoint PPT presentation | free to view

Diversity and inclusion (D&I) are strategic imperatives for businesses trying to innovate and remain competitive in today’s globally linked economy. According to a McKinsey analysis, organizations in the top quartile for gender diversity on executive teams were 21% more likely to have above-average profitability than those in the worst quartile. But how can technology, notably custom software, be used to promote D&I in hiring?
| PowerPoint PPT presentation | free to download

Joan Vuyanich began working as an agent contact clerk in ... Cumulative Frequency Polygon - Ogive. 16. Boxplot. Minimum. Lower Quartile. Median. Upper Quartile ...
| PowerPoint PPT presentation | free to view

China Canada Mexico ... Revenue authorities' standpoint ... US / Canada. Use of (inter-quartile) range generally allowed ...
| PowerPoint PPT presentation | free to view

Choropleth Maps Intro to Choropleth Maps Two major ... 4 classes = quartiles 5 classes = quintiles Common Methods of Data Classification Mean and Standard ...
| PowerPoint PPT presentation | free to view

When the data is divided into 10 equal parts they are called Deciles. Quartiles ... The 5th decile D5 = 50th percentile = median = the 2nd quartile ...
| PowerPoint PPT presentation | free to view

Quartiles : divide data into 4 parts. Deciles : divide data into 10 parts. Percentiles: divide data into a hundred parts. Defining the Quartiles. To calculate the ...
| PowerPoint PPT presentation | free to view

Standard deviation: 10.85 inches. Minimum: 36 inches. Maximum: 78 inches. First quartile: 51.63 inches. Third quartile: 67.38 inches ... Denoted by 'x tilde' ...
| PowerPoint PPT presentation | free to view

The interquartile range. A Learning Object produced by. Sidney Tyrrell, Coventry University, ... Quartiles divide the data into quarters. 2 3 5 7 10 11 15 16. 2 ...
| PowerPoint PPT presentation | free to view

Track performance against standards. Metrics, Metrics, Metrics. ... the lights don't go out. Achieve Top Quartile Performance for System Reliability ...
| PowerPoint PPT presentation | free to download

Whose economy? Scotland in Northern Europe: balancing dynamic economies with greater social equality Current OECD quartile rankings overview for Scotland and Arc of ...
| PowerPoint PPT presentation | free to view

Data exploration: What you do for yourself when you first get the data. ... 'Box and whisker plots' Sometimes shows min, 1st quartile, median, 3rd quartile, max ...
| PowerPoint PPT presentation | free to view

Shows (range, median, quartiles) all in one: Variations: minimum. maximum. quartile ... If one system is better by all measures, a ratio game won't (usually) work ...
| PowerPoint PPT presentation | free to download

Box & Whisker Plot. 30, 34, 46, 26, 44, 24, 30, 26, 20, 40, ,36, 28, 45, 20, 18. Mean = 31 ... Box & Whisker Plot. 1st Quartile= 24. 2nd Quartile = 30. 3rd ...
| PowerPoint PPT presentation | free to view
Chapter 2 Describing Distributions with Numbers Numerical Summaries Center of the data mean median Variation range quartiles (interquartile range) variance standard ...
| PowerPoint PPT presentation | free to download

Title: MEDIAN IQR (INTER-QUARTILE RANGE) Author: pqr Last modified by: dep Created Date: 8/4/2005 9:28:52 AM Document presentation format: On-screen Show
| PowerPoint PPT presentation | free to download

Psych 611. Advanced Statistics and Research Methods in Psychology. Christopher Kello ... Skewness, kurtosis, central limit theorem, quartiles, outliers, difference ...
| PowerPoint PPT presentation | free to view

UQ 52mm. Inter-quartile range. The difference between the upper and lower ... Plot against the upper class boundaries. Draw a smooth curve thru' the points ...
| PowerPoint PPT presentation | free to view

When working online, students engage in many collaborative activities ... Box-and-whisker plots. Outlier: 1.5 * (IQR) 3rd Quartile ...
| PowerPoint PPT presentation | free to download

rank (top 10 customers) percentile (top 30% of customers) median, mode ... Ranking -- Top 10, quartile analysis. Access to detailed and aggregate data ...
| PowerPoint PPT presentation | free to download

Box and Whisker Plots and the 5 number summary Chapter 6 Section 7 Ms. Mayer Algebra 1 A box plot summarizes data using the median, upper and lower quartiles, and the ...
| PowerPoint PPT presentation | free to download

... neutral arrangements and without racist actors, disparities can still exist ... High'and 'low' refer to top and bottom quartiles. ...
| PowerPoint PPT presentation | free to view

The Capacity of the Aging Services Network: Top 10 Things to Know for Reauthorization AAA Budgets Average Budget: $ 7.5 million Lowest Quartile: $ 2.0 million Second ...
| PowerPoint PPT presentation | free to view

Measures of position Z-scores Percentiles Measures of position Z-scores position with ... D9 P10 , P20 , , P90 Quartiles : Q1 , Q2 , Q3 P25 , P50 , P75 ...
| PowerPoint PPT presentation | free to download

21 Measures of Dispersion Case Study 21.1 Range and Inter-quartile Range 21.2 Box-and-whisker Diagrams 21.3 Standard Deviation 21.4 Applications of Standard Deviation
| PowerPoint PPT presentation | free to view

A box-and-whisker plot can be useful for handling many data values. ... Box and whisker plots consists of the median, the quartiles, and the smallest ...
| PowerPoint PPT presentation | free to view

Use the concept of quantile. includes well-known concepts. median, quartiles etc ... Quantile ratios: US 1967 2004. Frank Cowell: TU Lisbon Inequality ...
| PowerPoint PPT presentation | free to view

To describe a distribution, find the shape, center, and spread of the distribution! ... Quartiles are used to measure spread as well: ...
| PowerPoint PPT presentation | free to view

quartile of the manager's universe, the evaluation is. compared with new managers and may be ... concentration to specific securities, investable universe (ex. ...
| PowerPoint PPT presentation | free to view
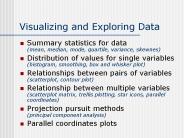
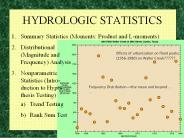
(mean, median, mode, quartile, variance, skewnes) ... Scree plot ... amount of variance explained by each consecutive value. Example (Huba et al. 1981) ...
| PowerPoint PPT presentation | free to download

Two Necessary Conditions for Improvement. POLITICAL WILL. TECHNICAL KNOW-HOW ... LAST Exam Failure Rate of New Teachers by Poverty Quartile, 2000-2005 ...
| PowerPoint PPT presentation | free to view

... identified in the lowest quartile this is all very good news. ... will have the technology instruction necessary to complete in today's high tech world. ...
| PowerPoint PPT presentation | free to view

Process of putting data into groups. Allows user to compare among groups ... Lower Quartile: cuts off of the data. Median: middle value ...
| PowerPoint PPT presentation | free to view

Excludes alternative, charter, and combination schools. r = -.91 ... Percent of Middle Schools* Meeting AYP Within Each Quartile based on Poverty: FY2007 ...
| PowerPoint PPT presentation | free to view

Please respond T (true) or F (false) to each of the following and show work if needed. _____(a) It is possible, for some set of data, that there are no values between the median and the upper quartile.
| PowerPoint PPT presentation | free to download

Period 9: Example regarding nuns and quartiles (if time) ... one other person and hand in one assignment (remember that you are responsible ...
| PowerPoint PPT presentation | free to view

ordinal: categories that can be ordered, or quantitative data that ... Box (& Whisker) Plot. range, quartiles, interquartile range, maximum, minimum, median ...
| PowerPoint PPT presentation | free to view

Normal fitting - yeast ORF lengths. The distribution does not fit a normal curve. Normal fitting with quartile estimates - yeast ORF lengths ...
| PowerPoint PPT presentation | free to view

Can we have information on the underlying probability distribution? ... 6.3.6 The 100p Sample Percentile (pth Sample Quantile) and sample quartile ...
| PowerPoint PPT presentation | free to view

scored in top quartile of self ratings of their enjoyment and comfort levels as teachers ... Participants enjoyed and benefited from camaraderie (focus groups ...
| PowerPoint PPT presentation | free to view

All grouped data is treated as continuous data so you do not have to round up or ... estimate by interpolation, the median and quartiles. estimate the mean ...
| PowerPoint PPT presentation | free to view

Where is this data value with respect to the other values in the ... P10 , P20 , ... , P90. Quartiles : Q1 , Q2 , Q3. P25 , P50 , P75. Percentile Aliases ...
| PowerPoint PPT presentation | free to view

Quartiles 1 and 2 are the cut scores that represent Proficiency Levels 1 & 2. ... Proficiency Profile is Mastery. Concept Mastery Report. GLCE Code and ...
| PowerPoint PPT presentation | free to view