
3d Cloud Visualization PowerPoint PPT Presentations
All Time
Recommended

Multi-cloud and hybrid cloud architectures are anticipated to play a crucial role in the future of cloud computing. Organizations are increasingly adopting multi-cloud strategies, utilizing services from multiple cloud providers to diversify risk, enhance flexibility, and optimize costs. Hybrid cloud solutions, combining on-premises infrastructure with public and private clouds, provide a balance between data security and scalability. This approach enables businesses to manage sensitive data on-premises while leveraging the scalability and agility of the cloud. The future will likely see a continued evolution in cloud types, allowing organizations to tailor their cloud strategies to meet specific business requirements.
| PowerPoint PPT presentation | free to download
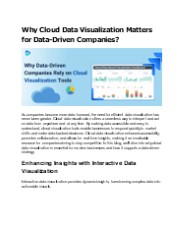
Cloud data visualization offers key benefits for growing businesses by providing real-time insights that support data-driven decisions. It enables companies to reduce data silos, improve collaboration, and leverage analytics for strategic growth, helping teams align with organizational goals and drive sustainable success.
| PowerPoint PPT presentation | free to download
Avail Operationalize Cloud Analytics Solutions with Microsoft Azure - 552242A - Course from Microsoft Training Partner Global Knowledge Technologies.
| PowerPoint PPT presentation | free to download
Finding the Dark Cloud: Static Analysis of Cloud Configurations Shriram Krishnamurthi Brown University * A Cloud of Policies Application Author: end-user access ...
| PowerPoint PPT presentation | free to download

Dave Randall (PI) (CSU), Akio Arakawa (UCLA) (CO-PI) ... 1 month runs aimed at numerical weather predictions. Run = two annual-cycle simulations ...
| PowerPoint PPT presentation | free to view

Evaluation of Tag Cloud visualizations of semantically ... Ben Good, Byron Kuo, Leon French. All survey participants. CIHR Bioinformatics Training Program ...
| PowerPoint PPT presentation | free to view

... cloud layers using Advanced Very High Resolution Radiometer (AVHRR) data. ... The above images show that the AVHRR algorithm is effective at detecting cloud ...
| PowerPoint PPT presentation | free to view

Webinar Link: https://goo.gl/cgjUk7 You'll be redirected to the webinar video once you have registered.
NexInfo presents a comprehensive Cloud Adoption Quick Guide to help businesses transition smoothly to the cloud. Explore key strategies, best practices, and tools for successful migration, ensuring efficiency, scalability, and long-term success in the cloud.
| PowerPoint PPT presentation | free to download
"3D/2D Web based visualization - Cloud based CAD for enterprises".To know more-http://bit.ly/2ri7UeH
| PowerPoint PPT presentation | free to download

"3D/2D Web based visualization - Cloud based CAD for enterprises".To know more go to-http://bit.ly/2ri7UeH
| PowerPoint PPT presentation | free to download

Cloud computing ppt All the benefits
| PowerPoint PPT presentation | free to download
This presentation will educate you about Data visulization, Why is data visualization important?, Benefits of data visualization, Benefits of data visualization and Some other popular techniques are as follows. for more topic stay tuned with Learnbay
| PowerPoint PPT presentation | free to download
Requirements Visualization
| PowerPoint PPT presentation | free to download

eNlight Cloud |ESDS SOFTWARE SOLUTION PVT. LTD.|
| PowerPoint PPT presentation | free to view
Gamer Textually Ballad collection of Samuel Pepys The Library of Babel Jorge Luis Borges (1941) ...
| PowerPoint PPT presentation | free to download
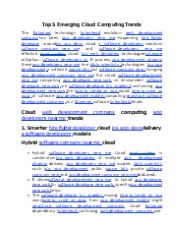
The Sataware technology byteahead evolution web development companyhas been app developers near me happening hire flutter developer aroundios app devs cloud a software developers solutions software company near me
| PowerPoint PPT presentation | free to download

We provide Point Cloud Modeling Services and 3D Laser Scan to BIM, PDMS, 3D Model, High-end visualization and VR experience services.
| PowerPoint PPT presentation | free to download
Avail Microsoft Cloud Workshop: Big Data & Visualization - 40502G - Course from Authorized Microsoft Training Partner Global Knowledge Technologies.
| PowerPoint PPT presentation | free to download
Marketing cloud ppt
| PowerPoint PPT presentation | free to download
The core function of acoustic ceiling clouds is to absorb sound and reduce reverberation in a space. When sound waves hit hard surfaces like walls, floors, or ceilings, they bounce back, causing unwanted echoes and background noise. In large spaces, this can make it difficult to hear clearly, whether in a meeting, a performance, or a restaurant.
| PowerPoint PPT presentation | free to download
NexInfo invites you to explore how Oracle QM Cloud can optimize your quality management processes. Learn strategies to improve quality control, streamline operations, and ensure compliance, all while enhancing efficiency and reducing costs.
| PowerPoint PPT presentation | free to download
Transform your business with Goognu’s GCP Managed Services. Reliable solutions for scaling and optimizing your cloud. Contact us https://goognu.com/services/gcp-managed-services to begin!
| PowerPoint PPT presentation | free to download

Experience simplified sales management with Salesforce Sales Cloud. Automate repetitive tasks, improve team collaboration, and provide real-time analytics for informed decision-making. Maximize customer engagement and grow your revenue with this innovative solution designed for modern businesses.
| PowerPoint PPT presentation | free to download
SAP Analytics Cloud provides below key features to end-users: - Data Discovery - Machine Learning capabilities - Integrated Financial and Business Planning - Predictive Analysis - Automated data cleansing - Data exploration and visualization To Join SAP Analytics Cloud Online Training batches, please feel free to call or email us. Email: Sangita@proexcellency.com, info@proexcellency.com Phone: +91- 9148251978, 08041506795 Website: www.proexcellency.com
| PowerPoint PPT presentation | free to download

NexInfo partners with OATUG to demonstrate how Oracle Cloud ERP and EPM can enhance healthcare reporting. Discover how these solutions streamline financial processes, improve data accuracy, and enable informed decision-making for better patient care and operations.
| PowerPoint PPT presentation | free to download

Hybrid Cloud Market
| PowerPoint PPT presentation | free to download
Open insights and enhance resolution with Data Analytics and Visualization Services. Transform raw data into actionable knowledge through advanced analytics, interactive dashboards, and visually enthralling reports. Empower your business to thrive in the data-driven era with expertise in extracting value from your data.
| PowerPoint PPT presentation | free to download

Climate modeling, powered by cloud computing, helps predict climate change impacts with precision and efficiency. To gain expertise in this transformative technology, **cloud computing classes in Pune** offer valuable opportunities to learn and contribute to this vital field.
| PowerPoint PPT presentation | free to download

Visualization in science Nata a Tepi What is visualization? You must never tell a thing. You must illustrate it. We learn through the eye and not the noggin.
| PowerPoint PPT presentation | free to view

ScienceDriven Visualization
| PowerPoint PPT presentation | free to view

All your IoT needs for the UbiBot IoT platform is a one-stop solution. It can manage all your big data and visualization to help you maximize the value of IoT for your business and all your devices from one location.
| PowerPoint PPT presentation | free to download

IaaS Cloud Benchmarking: Approaches, Challenges, and Experience Alexandru Iosup Parallel and Distributed Systems Group Delft University of Technology
| PowerPoint PPT presentation | free to view

Magellanic Clouds
| PowerPoint PPT presentation | free to download
Cloud-based machine learning is transforming scientific discovery by providing scalable computing power and advanced analytics tools, speeding up research in fields like genomics and climate science. It enables global collaboration and accelerates breakthroughs. For those seeking expertise, cloud computing classes in Pune offer essential training to leverage these technologies in research.
| PowerPoint PPT presentation | free to download

Data visualization transforms raw data into meaningful visual formats like charts, graphs, and dashboards, enabling businesses to identify trends, uncover insights, and make informed decisions. It simplifies complex datasets, enhances communication, and supports real-time analytics for better strategic planning. Tools like Power BI and Tableau make the process intuitive and impactful.
| PowerPoint PPT presentation | free to download
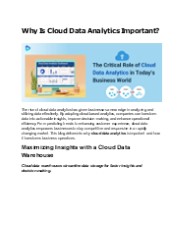
Cloud data analytics enables businesses to achieve better outcomes through real-time insights and seamless data access. By transforming data into actionable insights, organizations can streamline operations, reduce redundancies, and foster collaboration, positioning themselves for improved performance and innovation.
| PowerPoint PPT presentation | free to download

The art of using visual thinking to understand complex information. Origin (maps) ... data used by Fox news to show the results for the recent presidential election ...
| PowerPoint PPT presentation | free to view

Atmospheric Sounding Visualization Sancho McCann Permission is granted to copy, distribute and/or modify this document under the terms of the GNU Free Documentation ...
| PowerPoint PPT presentation | free to download

Financial Planning and Analysis Consulting Services are powerful tools that enable organizations to optimize their financial planning and analysis processes. By leveraging cloud computing technology, these solutions provide centralized data management, advanced forecasting capabilities, robust reporting and visualization features, scalability, flexibility, and enhanced accessibility. Implementing cloud FP&A solutions can empower finance teams to make informed decisions, drive financial performance, and contribute to the overall success of the organization.
| PowerPoint PPT presentation | free to download
Cloud analytics is a powerful tool for unlocking the next level of data intelligence. Discover the benefits, advantages, key features, and use cases of this essential technology.
| PowerPoint PPT presentation | free to download
The Data Visualization Market market landscape analysis provides a comprehensive overview of industry insights, drivers, top trends, and regional overview. https://www.adroitmarketresearch.com/industry-reports/xr-market
| PowerPoint PPT presentation | free to download

Data visualization transforms raw data into meaningful visual formats like charts, graphs, and dashboards, enabling businesses to identify trends, uncover insights, and make informed decisions. It simplifies complex datasets, enhances communication, and supports real-time analytics for better strategic planning.
| PowerPoint PPT presentation | free to download

Data visualization is the graphical representation of data to facilitate understanding and analysis. Visit Here: https://nareshit.com/data-science-online-training/
| PowerPoint PPT presentation | free to download

Cloud dreams is the best web designing company in Coimbatore and offering web design services in Coimbatore, website designing company in Coimbatore, top web designing companies in Coimbatore, best web designers in coimbatore, best website developers in coimbatore, website designing companies in coimbatore, Professional web design company Coimbatore, website design charges,price,rate in coimbatore
| PowerPoint PPT presentation | free to download
... ... 456789:CDEFGHIJSTUVWXYZcdefghijstuvwxyz GpSs tFTO ...
| PowerPoint PPT presentation | free to download

Excelize project success story, The food court is spread over an approximate area of 11900 sqft. With As built Model | Cost effective renovation, the project successfully completed in 2023.
| PowerPoint PPT presentation | free to download

Cloud computing enhances smartphone performance by offloading tasks to the cloud, surpassing hardware limits. For deeper insights, a cloud computing certification helps understand how cloud solutions optimize mobile functionality.
| PowerPoint PPT presentation | free to download

Real-time data visualization transforms supply chain management by providing real-time insights into logistics, inventory, and operations. Learn how this technology ensures efficiency, reduces disruptions, and improves decision-making in dynamic supply chain environments.
| PowerPoint PPT presentation | free to download

The sataware Cloud byteahead Business web development company intelligence app developers near me is a hire flutter developer cloud-based ios app devs Business a software developers intelligence software company near me tool software developers near me that app developer new york collects top web designers your sataware
| PowerPoint PPT presentation | free to download

From Global Precipitation Climatology Project. 13. 14. Extreme Events: ... From International Satellite Cloud Climatology Project. Clouds and cloud cover. 19. 20 ...
| PowerPoint PPT presentation | free to view

NexSigns is the best cloud based smart digital signage software designed to give you limitless control. Get a Demo of the top digital signage software.
| PowerPoint PPT presentation | free to download

With cloud ERP systems, businesses gain access to valuable data insights that help optimize workflows, improve decision-making, and increase operational efficiency, ensuring sustained growth.
| PowerPoint PPT presentation | free to download

When choosing a chart for data visualization, it’s important to match the chart type with the data being presented. Pie charts are great for showing proportions, as they clearly illustrate how different parts contribute to a whole, making it easier to understand percentage relationships compared to bar charts. Adobe Analytics provides a powerful tool for creating visual data representations, helping users gain insights from their data. By analyzing trends and patterns, users can make better decisions. To get the most out of Adobe Analytics, users should follow specific setup steps to ensure they can effectively visualize their data for the best results.
| PowerPoint PPT presentation | free to download