
Milton High School Environmental Studies Limestone Run Assessment - PowerPoint PPT Presentation
1 / 71
Title: Milton High School Environmental Studies Limestone Run Assessment
1
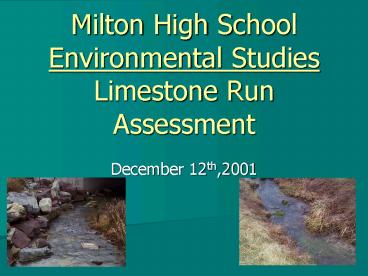
Milton High SchoolEnvironmental
StudiesLimestone Run Assessment
- December 12th,2001
2
(No Transcript)
3
Environmental Studies Class
- Gary Sassaman Dwight
Eberhart - Chase Satteson Nate
Chamberlin - Chris Buck Derek Rabuck
- Josh Allen Chuck Coup
- Matt Swallow Amanda Herman
- Matt Orso Jason Shutt
- Scott Coup
- Ryan Kelchner
- Randy Kramm
- Levi Yoder
4
Growing GreenerGrant
5
Limestone Run Watershed
- The watershed is 11.6 sq. miles.
- The stream is ten miles long.
- Most of watershed is open agricultural land.
- Routes 80 and 147 run through it and 254
parallels the creek.
6
Trout Unlimited s Description of Limestone Run
- This small stream has a mouth watering name
but in reality its not at all appealing. There
is limestone under the stream, and in some places
there is the right aquatic weed however, this
stream could be a case study titled cattle and
there effect. There is no shade, the banks have
been beaten down, its muddy, it is warm, and as
it is now, has nothing to recommend it.
7
Problems With Limestone Run
- On the 303d list
- Erosion and Sedimentation
- High Nitrate Levels
- Lack of Riparian Buffers
8
Past Activities
- In 1991 the class started doing water testing.
- From 1992-99 they continued doing watershed
treatment. - Form 99-00 the class picked up the Watershed
Concept. - In 99-00 the class also made its ten year plan.
9
Goals
- Fish Return
- Reduce Flooding
- Reduce Sediment
- Reduce Nutrients
- Reduce Temp.
- Repair Stream bank
- Increase Dissolved Oxygen
- Create A Riparian Buffer
10
Timeline
- 1999-2000 Beginning if ten year plan.
- 2000-2001 Coalition
- 2001-2003 Assessment
- 2006-2007 Trout Return
- 2009-2010 Experimental Hatchery
11
Stream Hydraulics
- - Pattern
- - Dimension
- Profile
12
Pattern
- The Sinuosity of the Creek.
13
Dimension
- Cross Sectional Profile
14
Profile
- Longitudinal Flow of Stream
15
Things that effect Pattern, Dimension and Profile.
- Depth
- Slope
- Width
- Velocity
- Flow Resistance
- Sediment Size
- Sediment Load
- Stream Discharge
16
(No Transcript)
17
Environmental StudiesBudget Equipment
- By Scott Coup, Ryan Kelchner, Randy Kramm
18
Grants
- The Environmental Studies class received two
grants. - Growing Greener Grant
- John G. Clark, Jr. Environmental Education Grant
given by Merrill W. Linn Land and Waterways
Conservancy
19
Grants
- Growing Greener Grant
- The Growing Greener Grant provides the
Environmental Studies class with 23,920. - It is good for 2 years.
- - The Grant calls for us to access 8 miles of
Limestone Run.
20
- John G. Clark Jr. Environmental Educational Grant
- The Linn Conservancy Grant of 486 provided funds
to buy two tidbits and an optic shuttle. - -The equipment will help the Environmental
Studies class to collect data on the fluctuating
water temperature of Limestone Run.
21
Budget for the Growing Greener Grant
- 1. Sponsor Salaries/Benefits 1,300
- 2. Equipment and Supplies 11,620
- 3. Contractual 5,000
- 4. Construction (Stream bank fencing) 6,000
- 5. Total 23,920
22
Equipment
- 1 Lap Top Computer 3,830.44
- 1 Digital Camcorder 892.59
- 1 Digital Camera 483.10
- 2 GPS/GIS Receivers 567.90
- 3 Hip Chains 218.00
- 2 100ft Tape Measure 59.50
- 1 300ft Tape Measure 39.95
- 4 Waders 210.00
23
Equipment/Continued
- 4 Stowaway tidbits 396.00
- 1 Base Station/ Coupler Kit 70.00
- 1 Optic Shuttle 189.00
- 25 Safety Glasses 96.25
- 2 Armored Thermometer 19.00
- 2 (100/box) Latex Gloves 17.90
- 1 Boxcar 3.6 Starter Kit 14.00
- 2 Tuff Stuff Flagging Tape 3.20
24
Equipment/Continued
- 1 Kick Net with poles 78.00
- 3 6 Forceps 11.97
- 1 24/pk Wide Storage Bottles 23.85
- 1 Sledge Hammer 12.90
- 2 Model BP3180(Pruners) 49.90
- 1 Model RL Horizontal Laser 1,200.00
- 1 Tripod 120.00
- 1 Grade Rod 10ths or inches 80.00
25
Equipment/Continued
- 1 Sensor for Laser w/bracket 250.00
- ArcView GIS 3.2 495.00
- Magellan GPS Map 330M 538.00
- Canon Camera Accessories total
- 892.59
26
- This is a list of all the basic tools and
equipment that we use while out assessing
Limestone Run.
27
Mapping
- Uses
- Equipment Used
- Problems
28
Uses
- Show Data
- Future Comparison
29
(No Transcript)
30
Equipment
- GPS
- Hip Chains
- ArcView
31
Problems
- Programs Do Not Interface
- Security Setting On school Computer
32
Longitudinal Profile Measurement
-Chuck Coup -Amanda Herman -Randy Kramm -Ryan
Kelchner
33
Cross Section of Stream
Left Bank
Right Bank
TOP OF BANK
BANKFULL
WATERS EDGE
THALWAG
34
Longitudinal Profile
POOL
35
(No Transcript)
36
Cross Sectional Profile
- Scott Coup
- Matt Swallow
- Josh Allen
37
Procedures for Cross Section
- Establish benchmarks on each side of the stream
- Pound one piece of rebar in at each benchmark
- Attach the tape measure to the rebar with spring
clamps so that is stretches the width of the
stream.
38
Level II Assessment
- -Cross Sections
- Takes accurate measurements of the dimension of
the physical properties of the creek - Cross Sections are used to find problems with the
stream so we can repair the flaws
39
Limestone Run Restoration Project
- Pebble Count
- What do pebbles have to do with the stream?
- How the pebbles affect the stream.
40
Pebble Count
- Pebbles affect the streams water speed.
- The rocks in the stream can either slow down
the water speed or speed it up. - The bigger the rocks the slower the water.
This is because the rocks cause resistance of the
current - The smaller the rocks the faster the
current can go. This is because the water has no
resistance from rocks.
41
Pebble Count
- The Pebbles also can fill up a stream bed which
is a problem with some streams.
42
Pebble Count
- The Process
- In a reach or part of a stream you go about
every 100ft and measure 10 pebbles at the tip of
you boot.
43
Pebble Count
- The process /cont.
- When you pick up your first rock you measure
the three longest axis of the pebble( length,
height, width). Then you record those records.
44
Stream Bank Assessment
- Chris Buck and Matt Orso
45
Introductionto Stream Bank Assessment
- We used the U.S. Fish and Wildlife Services
Stream and Riparian Habitats Rapid Assessment
Protocol. The Protocol is a comprehensive stream
assessment and inventory protocol which
incorporates riparian corridor and stream
stability assessments. The protocol is for use
for us to rapidly identify, assess, and
prioritize stream corridor conditions within a
watershed. The assessment only provides a
relative ranking rather than a quantitive
evaluation of magnitudes of change. The
information gained will give us an idea of the
potential problems but not identify cause and
effect relationships influenced by factors
located outside the assessment area. To figure
out the main problem and cause and effect we
would need to complete a more detailed assessment.
46
The Two Main Assessment Sections
- Stream stability
- Bank Height Root Depth Root Density
- Bank Angle Surface Protection
- Aggrading Stream Beds
- Degrading Stream Beds
- Riparian an In stream Habitat Assessment
- Instream Cover Epifaunal Pool
Variability - Shading Water Appearance Nutrient
Enrichment - Bank Vegetation Riparian Vegetation
Riparian Zone - Nutrient Uptake Potential
47
Results
- RIH SS TOTAL
- 7 Springs Farm 34 9 43
- Lidecker 43 44 87
- Hoover 1 30 38 68
- Cottner 58 48 106
- Hoover 2 41 17 58
48
Results
- RIH SS TOTAL
- Robert Pfleegor 70 64 134
- Davis Farm 62 65 127
- James Farm 40 60 100
- Catholic Pavilion 51/204 74 127
- Woods to 147 Bridge 159/204 82 241
49
Chemical Testing
- Alkalinity
- Hardness
- pH
- Nitrates
- Ammonia
- Dissolved Oxygen
- Dissolved Carbon Dioxide
- Chloride
- Silica
50
Alkalinity
- Refers to the capability of water to neutralize
acid. - Alkalinity comes from the calcium and magnesium
in the stream. - Preferred Alkalinity of fresh water streams100 -
200ppm - Our results between 150-220ppm out of the 6 sites
we tested.
51
Hardness
- Measure of positively charged metal ions in the
water such as calcium, manganese, and iron. - The preferred level of Hardness in fresh water
streams 61-120ppm - Our results were between 260-310ppm. (6 Sites)
52
pH
- Measure of hydrogen concentrations in the water.
- The preferred levels of pH in freshwater streams
6.5-8.2 - Our results were between 7.5-8.5 (6 Sites)
53
Nitrates
- Come from the decay of organic materials and
fertilizers that have drained into the stream. - Preferred levels of nitrates in fresh water
streams less than 1ppm. - Our results were between 17.2-18.9. (6
Sites)
54
Ammonia
- Waste product of metabolism
- Found in streams, most likely from direct animal
waste. - Preferred levels of ammonia in fresh water
stream .1-.15ppm - Our results were all less than 1ppm. (6
Sites)
55
Dissolved Carbon Dioxide (CO2)
- Comes from the decay of organic materials.
- Dissolved Carbon Dioxide makes respiration
difficult for aquatic organisms. - Preferred levels of carbon dioxide none
measurable - Our results were between 2-15ppm. (6
Sites)
56
Dissolved Oxygen
- Amount of oxygen that is free and can be used by
aquatic organisms - Preferred level of dissolved oxygen in fresh
water streams 6-10ppm - We did not get the opportunity to test dissolved
oxygen at this time.
57
Chloride
- May be from naturally occurring salt deposits in
the earth or from industrial waste and sewage. - Preferred levels is 10-20 mg/L
- Our results were 42-70mg/L. (6 Sites)
58
Silica
- Occurs naturally in streams
- Used by some aquatic organisms to build up their
skeletal structure. - Preferred levels of silica in fresh water
streams 10-20ppm - Our results were 1-7ppm . (6 Sites)
59
Biological Testing
- Josh Allen and Matt Swallow
60
Macroinvertabrate Testing
- Location
- Tools
- Process
- Results
61
Water Quality Rating
SITE SCORE RATING
gt 40 GOOD
1 and 2 (21.1, 21.6) 20-40 FAIR
lt 20 POOR
62
Index Created By
- State Parks Watershed Education
Macroinvertabrate Stream Assessment (Level 1)
63
Limestone Run Restoration Project
- What are the purposes for Riparian
- Buffers and Stream Bank Fences?
- What is some of the Vegetation used for the
Riparian Buffers? - What will Riparian Buffers and Stream Bank
Fences do for the environment?
64
Limestone Run Restoration Project
- Riparian Buffers
- Purposes
- Reduce soil erosion
- Prevent excess nutrients-nitrogen and phosphorous
- Provide necessary food, cover, and shade for
wildlife - Hunters and Anglers enjoy a variety of game
species - Unique learning opportunities (serve as outside
classrooms) - Hikers and Campers enjoy the aesthetic qualities
provide by a well-managed riparian zone
65
Limestone Run Restoration Project
- Riparian Buffers
- Zone 1-
- Matures forest along waters edge to maintain
habitat, food, water temperature, and helps
stabilize banks and remove nutrients. - Vegetation Requirements
- Red Maple Black Maple
- Silver Maple Red Ash
- Shad Bush Sweet-boy Magnolia
- Yellow Birch Black Willow
66
Limestone Run Restoration Project
- Riparian Buffers
- Zone 2 Vegetation
- Zone 2 contains a managed forest. The primary
function of Zone2 is to remove sediment,
nutrients and other pollutants from surface and
ground water. It also provides habitat and
allows for economic benefits to the landowner
from the forest resource. - White Ash Shrubs
- Honey Locust Black Walnut
67
Limestone Run Restoration Project
- Riparian Buffers
- Zone 3 Vegetation
- Zone 3 contains grass filter strips, level
spreaders or other features which can slow
runoff, infiltrate water and help filter sediment
and its associated chemicals. - Tall Grasses
68
Limestone Run Restoration Project
- Stream bank Fencing
- Process used to help keep cattle out of the
stream. - Reduces stream bank erosion.
- Increases habitat for micro organisms.
- Help protect the buffer along the edge of the
stream bank.
69
Limestone Run Restoration Project
- What is CREP?
- What land is eligible for CREP, and what are the
Price Ranges? - What are some of the goals for CREP?
70
Limestone Run Restoration Project
- CREP
- A new program in PA started in June 2000.
- A USDA program
- Founded by state and non-profit partners
- The Govt leases the land from the property owner
for 15 yrs. - 50 on each side of the stream.
71
Limestone Run Restoration Project
- CREP
- Average Price per acre.
- Northumberland Co. 100-115
- Montour Co. is slightly higher.
- Prices depend upon soil type and quality
- Lowest price in North is Hv soil _at_ 88/acre.
- Highest price in North is WsA soil _at_ 116/acre.
- The soils for the land can be determined in the
local soils book. - Goals of CREP.
- Decrease soil erosion and runoff.
- Improve water quality.
- Improve wildlife and fisheries habitat.
- Increase farm income on marginal land.
Recommended
CrystalGraphics Presentations


