
Curve sketching - PowerPoint PPT Presentation
1 / 13
Title:
Curve sketching
Description:
Curve sketching This PowerPoint presentation shows the different stages involved in sketching the graph Sketching the graph Curve sketching Sketching the graph ... – PowerPoint PPT presentation
Number of Views:96
Avg rating:3.0/5.0
Title: Curve sketching
1
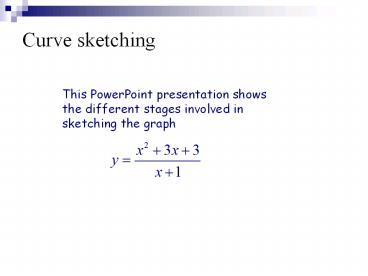
Curve sketching
This PowerPoint presentation shows the different
stages involved in sketching the graph
2
Sketching the graph
Step 1 Find where the graph cuts the axes
When x 0, y 3, so the graph goes through the
point (0, 3).
When y 0, there are no real values of x, so the
graph does not cut the x-axis.
3
Sketching the graph
Step 2 Find the vertical asymptotes
The denominator is zero when x -1
The vertical asymptote is x -1
4
Sketching the graph
Step 2 Find the vertical asymptotes
The denominator is zero when x -1
The vertical asymptote is x -1
For now, dont worry about the behaviour of the
graph near the asymptote. You may not need this
information.
5
Sketching the graph
Step 3 Examine the behaviour as x tends to
infinity
Dividing out gives
For numerically large values of x, y ? x 2.
This means that y x 2 is an oblique asymptote.
6
Sketching the graph
Step 3 Examine the behaviour as x tends to
infinity
Dividing out gives
For numerically large values of x, y ? x 2.
This means that y x 2 is an oblique asymptote.
7
Sketching the graph
Step 3 Examine the behaviour as x tends to
infinity
Dividing out gives
For numerically large values of x, y ? x 2.
This means that y x 2 is an oblique asymptote.
For large positive values of x, y is slightly
greater than x 2.
So as x ? 8, y ? x 2 from above.
8
Sketching the graph
Step 3 Examine the behaviour as x tends to
infinity
Dividing out gives
For numerically large values of x, y ? x 2.
This means that y x 2 is an oblique asymptote.
For large negative values of x, y is slightly
less than x 2.
So as x ? 8, y ? x 2 from below.
9
Sketching the graph
Step 3 Examine the behaviour as x tends to
infinity
Dividing out gives
For numerically large values of x, y ? x 2.
This means that y x 2 is an oblique asymptote.
For large negative values of x, y is slightly
less than x 2.
So as x ? 8, y ? x 2 from below.
10
Sketching the graph
Step 4 Complete the sketch
It is easy to complete the part of the graph to
the right of the asymptote, which must pass
through the point on the y axis.
11
Sketching the graph
Step 4 Complete the sketch
It is easy to complete the part of the graph to
the right of the asymptote, which must pass
through the point on the y axis.
12
Sketching the graph
Step 4 Complete the sketch
We can also complete the part of the graph to the
left of the asymptote, remembering that the graph
does not cut the x-axis.
13
Sketching the graph
Step 4 Complete the sketch
We can also complete the part of the graph to the
left of the asymptote, remembering that the graph
does not cut the x-axis.
Recommended
CrystalGraphics Presentations


