
Greywater - PowerPoint PPT Presentation
Title:
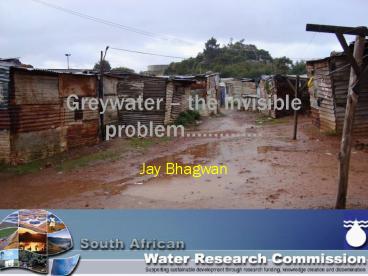
Greywater
Description:
Greywater the invisible problem .. Jay Bhagwan * THIS IS NOT THE CASE IN LOW INCOME AND INFORMAL AREAS!!! Our guides told us that the residents of ... – PowerPoint PPT presentation
Number of Views:31
Avg rating:3.0/5.0
Title: Greywater
1
Greywater the invisible problem..
Jay Bhagwan
2
THIS IS NOT THE CASE IN LOW INCOME AND
INFORMAL AREAS!!!
3
(No Transcript)
4
(No Transcript)
5
(No Transcript)
6
(No Transcript)
7
(No Transcript)
8
(No Transcript)
9
(No Transcript)
10
(No Transcript)
11
(No Transcript)
12
(No Transcript)
13
(No Transcript)
14
(No Transcript)
15
(No Transcript)
16
(No Transcript)
17
(No Transcript)
18
(No Transcript)
19
(No Transcript)
20
(No Transcript)
21
Our guides told us that the residents of Kanana
use this trench as a dumping area for household
rubbish mostly human urine and faeces. One of
the guides had just finished working for a group
that was cleaning the trench. While they were
cleaning people disposed of their urine and
faeces chamber in the trench. Some disposed 25
litre buckets and rubbish bags full of faeces
22
So what are the issues.
- Focus is on taps and toilets
- Legislation limiting
- Case of South Africa, sanitation covers grey
water - Institutional fragmentation
- Fragmentation of responsibilities between Water
Services and Roads Drainage - Ignorance from both community and authority OR
Neglect (VALUE) - Resource or waste?
- Guidelines exists but ignored
- Low density lt500l/ha.day (generally equates to
densities of lt10 du/ha and plot sizes gt800m2).
Soakaways installed at water collection points
and standpipes should be sufficient to protect
water resources and prevent health risks. - Low / Medium density 500-1500l/ha.day (equates
to densities of 10-30du/ha and plot sizes
800-300m2). Soakaways must be installed at
tapstands and in-home or yard connections should
be connected to an on-site disposal system. - Medium / High density 1500-2500l/ha.day
(equates to densities of 30-50du/ha and plot
sizes 300-150m2). If yard connections are
supplied as recommended by DWAF, on-site disposal
systems should be installed otherwise formal
washing areas with disposal options are required. - High density gt2500l/ha.day (equates to
densities of gt50du/ha and plot sizes lt150m2).
There should be off-site disposal of all
effluent.
23
Key challenges ARE TO
- there is no ponding of the greywater (Health)
- that the greywater does not get into surface
water systems (environmental) - that greywater is not allowed to build up in the
soil to such an extent that it becomes a hazard.
(salinity)
24
Scale of problem or opportunity
- Return flows in low income areas between 80 to
90 - estimated at just over 600,000m3 per day in South
Africa (medium sized dam)
25
QUALITY IS 10 TO 20 FOLD HIGHER THAN WHAT IS
RECORDED FOR DEVELOPED AREAS
Summary of monitored grey water loads from 7
households for 1 week
COD (g/day) SS (g/day) NH4 (g/day) NO3 (g/day) NO2 (g/day) PO4 (g/day) TDS (g/day) Fe (g/day) Total Coliform (cfu/day) Faecal Coliform (cfu/day)
Minimum 141.86 37.66 0.27 0.24 14.98 0.04 62.97 0.00 9.59E09 1.28E08
Maximum 208.00 170.21 3.78 1.27 87.23 2.55 181.18 0.09 1.88E10 4.25E10
Median 185.26 69.77 1.48 0.30 35.14 0.25 162.50 0.05 1.42E10 1.72E08
Mean 184.16 79.71 1.66 0.45 43.56 0.60 141.45 0.05 1.42E10 1.52E09
St. dev 23.35 46.36 1.42 0.40 29.68 0.96 45.39 0.03 6.52E09 2.36E09
26
Comparison of greywater quality resultsNote
Values are quoted in mg/l if not stated otherwise
Variable This study (2005) Eriksson et al (2002) Källerfelt Nordberg (2004) Pollution Research Group (2005) Stephenson et al (2006)
pH 3.3-10.9 5.0-8.7 6.1-7.0 5.8-6.3 -
Conductivity (mS/m) 28-1763 32-2000 83-132 144-148 -
PO4-P 0.7-769 0.6-68 14.8-56.2 11 0.3-18.9
COD 32-11451 13-549 530-3520 1135 999-1625
Suspended solids - 6.4-330 69.0-1420 - 265.2-1261
Oil Grease 8-4650 3.1-12 - - -
TKN 0.6-488.0 2.1-31.5 - 24-30 -
Ammonia Nitrogen 0.2-44.7 0.03-25.4 - 20 -
Sodium 96-1700 29-230 - - -
Water parameter Usual range in irrigation water Range at which restrictions on use for irrigation are imposed Range at which restrictions on use for irrigation are imposed Range at which restrictions on use for irrigation are imposed
Water parameter Usual range in irrigation water None Slight to moderate Severe
Electrical conductivity, EC (mS/m) 0 300 lt70 70 - 300 gt300
Total Dissolved solids, TDS (mg/l) 0 2000 lt450 450 - 2000 gt2000
Nitrate Nitrogen, NO3-N (mg/l) 0 10 lt5 5 - 30 gt30
Ammonia Nitrogen, NH4-N (mg/l) 0 5 - - -
Phosphate Phosphorous, PO4-P (mg/l) 0 2 - - -
Boron, B (mg/l) 0 - 2 lt0.7 0.7 3.0 gt3.0
pH 6.5 8.4 - - -
Sodium Adsorption Ratio (me/l) 0 - 15 gt2.9 1.3 - 2.9 lt1.3
Water quality guidelines for agriculture (Ayers
Westcott, 1994)
27
findings from studies
- The quality of greywater in non-sewered areas
differs significantly to the greywater that is
generated in higher-income, sewered areas in that
there is a greater variation in the concentration
of the various pollutants and at its most
concentrated it should be considered hazardous. - There is therefore significant risk involved with
the on-site disposal of greywater in non-sewered
areas.
28
Conclusion
- The focus has been on technology, however the
social element is not quite understood. - Fragile community structures unable to shift
beyond daily realities - There are many very innovative technical
solutions. The question is how appropriate are
these? - Greywater is a drainage issue and needs greater
attention
Recommended
CrystalGraphics Presentations


