
HIGH-SPEED RAIL IN AMERICA - PowerPoint PPT Presentation
1 / 30
Title:
HIGH-SPEED RAIL IN AMERICA
Description:
www.america2050.org – PowerPoint PPT presentation
Number of Views:162
Avg rating:3.0/5.0
Title: HIGH-SPEED RAIL IN AMERICA
1
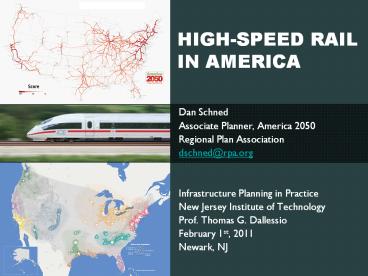
HIGH-SPEED RAIL IN AMERICA
- Dan Schned
- Associate Planner, America 2050
- Regional Plan Association
- dschned_at_rpa.org
- Infrastructure Planning in Practice
- New Jersey Institute of Technology
- Prof. Thomas G. Dallessio
- February 1st, 2011
- Newark, NJ
2
- Founded in 1922 as the Committee on A Regional
Plan of New York and its Environs. The 1st
Regional Plan was published in 1929, 2nd in 1968,
3rd in 1996 A Region at Risk - Private, independent, non-governmental
organization with offices in NY, NJ, and CT - Professional staff of urban planners,
transportation planners, architects, and urban
designers - Through research, planning, and advocacy RPA
works to achieve the goals set forth in the
Regional Plan
3
- A national initiative (within RPA) to meet the
infrastructure, economic development and
environmental challenges of the nation
- Guided by the National Committee for America
2050, a coalition of regional planners, scholars,
and policy-makers to develop a framework for the
nation's future growth
- A major focus is the emergence of megaregions
large networks of metropolitan areas, where most
of the population growth by mid-century will take
place
4
Rapid population growth and demographic change
Threats to our global competitiveness
Global climate change and foreign oil dependence
Economic disparities and loss of opportunity
5
Cascadia
No. California
Great Lakes
Front Range
So. California
Northeast
Texas Triangle
Sun Corridor
Piedmont Atlantic
Gulf Coast
Florida
6
Economic Benefits of High-Speed Rail
- Boost productivity for service and knowledge
sector businesses - Deepen labor markets for employers and broaden
employment pool for workers
Source Martin Prosperity Institute, Univ. of
Toronto
7
How does HSR promote economic development?
3. Foster economic synergies among specialized
industries (agglomeration economies)
Image Univ. of Penn, Northeast Megaregion
Studio, 2005
8
How does HSR promote economic development?
4. Stations serve as a focal points of future
development 5. Make better, more efficient use
of infrastructure
Eurostar Station and development, Lille, France
9
How does HSR promote economic development?
6. Transformative effects
The interstate system fundamentally altered
relationships between time, cost, and space in a
manner which allowed new economic opportunities
to emerge that would never have emerged under
previous technologies.
Map Source National System of Interstate
Highways, Public Roads Administration, 1947
Quote source The Economic Impact of the
Interstate Highway System. NCHRP Project 20-24
(52) FY 2006
10
Cautions and Caveats
- HSR is not a stand-alone economic development
tool - HSR benefits tend to be one way streets,
especially for park and ride stations
Haute Picardie aka beetroot station
Lyon St. Exupery Station Image Flickr/
VerseVend
11
America 2050 HSR Reports
- Where High-Speed Rail Works Best
- High-Speed Rail in America
12
Where High-Speed Rail Works Best
www.America2050.org
13
Where High-Speed Rail Works Best
- Economic Productivity
- Congestion
- In a Megaregion
- Population
- Distance of Corridor
- Transit Connections
14
High-Speed Rail in America
15
High-Speed Rail in America
- Each criterion was standardized on a per mile
basis - Each criterion was ranked on relative value in
its class - Rankings were indexed and converted to values
between 0 and 1 - FINAL EQUATION3x (RPECBD) 2x(TECTCPCPCE
RPGERAM) 1x (CRPCTCSFST) - Corridor Score
- Possible scores between 0 and 21
Primary Factors Weighted 3X
Regional Population (25-Miles) RP
Employment CBD (2-Miles) EC
Secondary Factors Weighted 2X
Transit Connectivity Employment TCE
Transit Connectivity Population TCP
City Population (10 Mile) CP
City Employment (10 Mile) CE
Regional Population Growth Factor RPGF
Regional Air Market RAM
Tertiary Factors Weighted 1X
Commuter Rail Connectivity Population CRP
Corridor Traffic Congestion CTC
Share of Financial Workers SF
Share of workers in tourism and hospitality ST
16
Regional Population (x3)
2 Mi
10 Mi
25 Mi
4.5M
4.6M
PHI HOU
220K
72K
2.1M
1.5M
PHI HOU
PHI HOU
17
Employment CBD (x3)
Philadelphia
Houston
2 Mi
10 Mi
25 Mi
2.2M
2.1M
PHI HOU
235K
136K
843K
905K
PHI HOU
PHI HOU
18
Secondary Criteria (x2)
Value Rank
Transit Connectivity Employment 36 14
Transit Connectivity Population 15 12
City Population (10 mile) 1.3M 15
City Employment (10 mile) 627K 20
Regional Population Growth Factor 35 n/a
- Baltimore
19
Secondary Criteria (x2)
- Regional Air Market
20
Traffic Congestion (x1)
21
Employment Mix (x1)
- Share of employment in service sector / knowledge
industries - Finance and insurance
- Real estate, rental and lease
- Arts, entertainment and recreation
- Accommodation and food services
22
Northeast
- Pros and Cons
- CBDs
- Density
- Population
- Transit Access
- Regional Air Market
- Employment Mix
- Growth Factor
- Governance
- ROW / NIMBY
- Backlog SOGR
- Top Corridors
- NYC-WAS - 20.1
- BOS-NYC - 19.9
- NYC-PHI - 19.9
- WAS-BOS - 19.8
- NYC-ALB - 19.3
- HARPHI - 18.0
23
Northern California
- Pros and Cons
- CBDs
- Regional Population
- City Population
- Growth Factor
- Regional Air Market
- Employment Mix
- Governance
- Density
- Transit Access
- ROW / NIMBY
24
Southern California
- Pros and Cons
- Regional Population
- City Population
- Growth Factor
- Regional Air Market
- CBDs
- Employment Mix
- Governance
- Density
- Transit Access
- ROW / NIMBY
25
California and the Southwest
- Top Corridors
- LA-SAN - 19.6
- LA-Riverside - 19.4
- LA-Santa Barbara - 19.0
- SAC-SF - 18.2
- LA-San Fran - 18.0
- LA-Las Vegas - 16.9
26
Florida
- Top Corridors
- TPA-ORL - 13.93
- TPA-MIA - 13.63
- SBT-VRB - 12.96
- ORL-ATL - 10.83
- JCK-ATL - 10.79
27
Obama Administration High-Speed Rail Vision
Within 25 years, our goal is to give 80 of
Americans access to high-speed rail. --
President Obama in his 1/25/2011 State of the
Union Speech
Source Associated Press
28
Future of HSR in America
29
Long-Term Commitment
30
www.america2050.org
www.rpa.org
Recommended
CrystalGraphics Presentations


