Microelectronics - PowerPoint PPT Presentation
1 / 1
Title:
Microelectronics
Description:
Automatic 3D Image Segmentation of Internal Lung Structures Advisor Student Dr. Jia Li Shaojun Liu Dept. of Computer Science and Engineering, Oakland University – PowerPoint PPT presentation
Number of Views:53
Avg rating:3.0/5.0
Title: Microelectronics
1
Automatic 3D Image Segmentation of Internal
Lung Structures
Advisor StudentDr. Jia Li Shaojun LiuDept. of
Computer Science and Engineering, Oakland
University
- 1. Abstract
This poster presents a new solution for automatic
3D image segmentation of internal lung
structures. We combine the gradient and intensity
to depress the noise and make level set based
segmentation algorithm more stable. The
experimental results show that our solution gives
good results on the public lung image data.
- 2. Introduction
Image segmentation plays an important role in
image processing applications, such as computer
aided diagnose (CAD), automatic classification,
and computer aided surgery. It becomes more
challenging on human lungs because of the complex
topologies of the internal structures, such as
the bronchial tree. As the internal structures
vary with different diseases, like the nodule and
tumor, accurate 3D information of the internal
structures is helpful to doctors for early
diagnose and treatment. Level set is a popular
method in this area and many approaches have been
proposed for various improvement purposes. For
example, as the gradient contains noise, image
intensity is used to assist segmentation in the
Expectation-Maximization (EM) approach. However,
the result is influenced by initialization and
global optimum is not guaranteed. We combine the
intensity and gradient to depress the gradient
noise and make the result more stable.
- 3. Segmentation
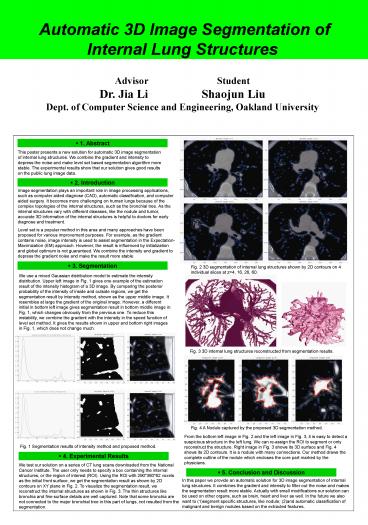
Fig. 2 3D segmentation of internal lung
structures shown by 2D contours on 4 individual
slices at z4, 16, 26, 60.
We use a mixed Gaussian distribution model to
estimate the intensity distribution. Upper left
image in Fig. 1 gives one example of the
estimation result of the intensity histogram of a
3D image. By comparing the posterior probability
of the intensity of inside and outside regions,
we get the segmentation result by intensity
method, shown as the upper middle image. It
resembles at large the gradient of the original
image. However, a different initial in bottom
left image gives segmentation result in bottom
middle image in Fig. 1, which changes obviously
from the previous one. To reduce this
instability, we combine the gradient with the
intensity in the speed function of level set
method. It gives the results shown in upper and
bottom right images in Fig. 1, which does not
change much.
Fig. 3 3D internal lung structures reconstructed
from segmentation results.
Fig. 4 A Nodule captured by the proposed 3D
segmentation method.
From the bottom left image in Fig. 2 and the left
image in Fig. 3, it is easy to detect a
suspicious structure in the left lung. We can
re-assign the ROI to segment or only reconstruct
the structure. Right image in Fig. 3 shows its 3D
surface and Fig. 4 shows its 2D contours. It is a
nodule with many connections. Our method draws
the complete outline of the nodule which encloses
the core part marked by the physicians.
Fig. 1 Segmentation results of intensity method
and proposed method.
- 4. Experimental Results
We test our solution on a series of CT lung scans
downloaded from the National Cancer Institute.
The user only needs to specify a box containing
the internal structures, or the region of
interest (ROI). Using the ROI with 29038062
voxels as the initial front surface, we get the
segmentation result as shown by 2D contours on XY
plane in Fig. 2. To visualize the segmentation
result, we reconstruct the internal structures as
shown in Fig. 3. The thin structures like
bronchia and fine surface details are well
captured. Note that some bronchia are not
connected to the major bronchial tree in this
part of lungs, not resulted from the segmentation.
- 5. Conclusion and Discussion
In this paper we provide an automatic solution
for 3D image segmentation of internal lung
structures. It combines the gradient and
intensity to filter out the noise and makes the
segmentation result more stable. Actually with
small modifications our solution can be used on
other organs, such as brain, heart and liver as
well. In the future we also want to (1)segment
specific structures, like nodule (2)and
automatic classification of malignant and benign
nodules based on the extracted features.


