
Radar Displays - PowerPoint PPT Presentation
Title:
Radar Displays
Description:
PPI - Plan position Indicator Maps the received signals on polar coordinates in plan view. The antenna scans 360 at fixed elevation angle. At every azimuth the ... – PowerPoint PPT presentation
Number of Views:79
Avg rating:3.0/5.0
Title: Radar Displays
1
Radar Displays
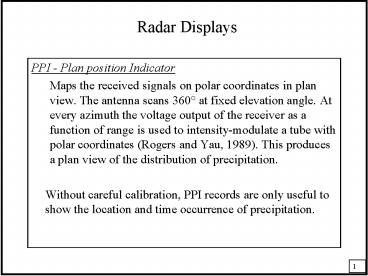
- PPI - Plan position Indicator
- Maps the received signals on polar coordinates in
plan view. The antenna scans 360 at fixed
elevation angle. At every azimuth the voltage
output of the receiver as a function of range is
used to intensity-modulate a tube with polar
coordinates (Rogers and Yau, 1989). This produces
a plan view of the distribution of precipitation. - Without careful calibration, PPI records are
only useful to show the location and time
occurrence of precipitation.
2
(No Transcript)
3
Radar Displays - cont.
- RHI - Range Height Indicator
- This display is generated when the antenna scans
in elevation with fixed azimuth, thereby showing
the details of the vertical structure of
precipitation. - CAPPI - Constant Altitude PPI
- Azimuth and altitude are varied systematically to
survey region surrounding the radar site.
4
PPI
RHI
5
HTI
6
Precipitation Processes
- Areal extent and lifetime of precipitation are
largely controlled by vertical motions - Customary to classify precipitation according to
the dominant mechanism for the vertical motion - Two major classifications
- 1. Widespread, stratiform continuous precip.
associated with large scale ascent - 2. Localized, convective showery precip.
associated with cumulus-scale convection - The distinction between the two is not always
sharp. However, it is usually possible to
describe a pattern as either markedly uniform
(stratiform) or non-uniform (convective).
7
Example of a radar reflectivity pattern from a
stratiform precip. event . (Fig. 11.1, Rogers,
1979)
Stratiform Precipitation
- evolves relatively slowly with time
- usually associated with nimbostratus clouds
- radar reflectivity (Z) pattern is relatively
uniform - vertical air motion is weak
- gravitational settling determines the Z pattern
8
Time-Height Pattern of Z and Doppler Velocity
- The contours I 65 and 95 correspond to 30 and 0
dBz, respectively. (Fig. 11.2 Rogers, 1979 see
Fig 12.5)
- Doppler Velocity is constant with time and
decreases upward - Z decreases upward and is constant with time.
- Results from small raindrops near top of echo
slowly falling through the cloud growing by
coalescence.
9
Example of Radar Bright Band
Doppler Velocity m/sec
Reflectivity
Height above ground (km)
Doppler Velocity
Reflectivity Factor DMZ
PPI View at 8 elevation
From Rogers, 1979 see Rogers and Yau, Fig. 12.3
- Bright Band is located in a transition layer
from snow to rain
10
Bright Band Explanation
- Bright Band is located in a transition layer
from snow to rain. - Z increases because
- Dielectric constant of water exceeds that of ice
by a factor of 4.Melting produces distorted wet
snow flakes with higher reflectivities than those
of spherical drops. - Z decreases because
- Raindrops fall faster than snowflakes therefore
their concentration in space is reduced, lowering
Z. - Note that the bright band is weak, diffuse or
absent if there is convective overturning because
mixing disrupts the stratification.
11
Showers
Fig. 11.6 Rogers (1979)
- Echoes have lifetimes the order of an hour
- Patterns evolve rapidly
- Convection dominates the growth process
- the same horizontal and vertical dimensions
12
Reflectivity Time-Height PatternWarm-Rain Shower
Intensity I DMZ 95 - I
Height (km)
Local standard time (hrs)
- Fig 11.7a, Rogers (1979) Fig. 12.7 Rogers and
Yau (1989)
13
Stratiform Precipitation - Summary
- Develop principally by the ice crystal process
- Last a long time - several hours
- Each level plays a distinct role
- Upper levels (T -20C) supplies ice crystals
- Mid-levels (T -15C) - rapid diffusional growth
- Low-levels - aggregation/accretion
- Useful approximation
- Stratiform rain is a steady state process in
which cloud quantities may vary with height but
are approximately constant with time at any given
height.
14
Convective Clouds - Summary
- High liquid water contents (wl)
- Coalescence process dominates
- Lifetimes are the order of 20 to 30 min
- Precipitation begins early in the developing
cloud at low levels - Initiation of precipitation may be by either the
coalescence or ice-crystal process, but most
growth is by accretion - Useful approximation
- Showers are systems in which the cloud
properties may vary with time, but they are
(approximately) constant with height at any given
time.
15
Horizontal Scales and Structure of Precipitation
- Every precip area contains one or more of each
smaller size - RLM 2 RS RSM 2 RLM RC 2-10 RSM
- Main contribution to total rainfall comes from
the small and large mesoscale areas
Recommended
CrystalGraphics Presentations


