
Methods - PowerPoint PPT Presentation
Title:
Methods
Description:
Neural networks mimic ... Tuning curves have been used extensively in both biological and computational applications because they ... the neuronal response ... – PowerPoint PPT presentation
Number of Views:33
Avg rating:3.0/5.0
Title: Methods
1
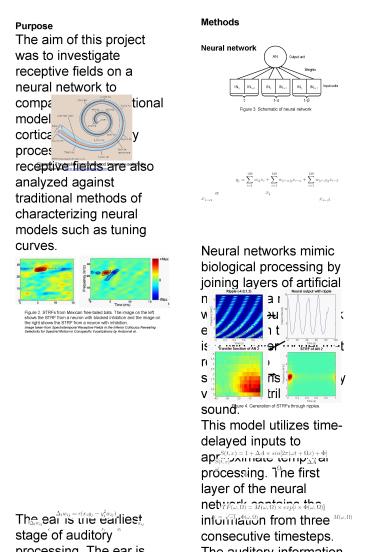
Methods Neural network Neural
networks mimic biological processing by joining
layers of artificial neurons in a meaningful way.
The neural network employed in this project is a
two-layer model that responds to spectrograms,
frequency vs. time distributions of sound. This
model utilizes time-delayed inputs to approximate
temporal processing. The first layer of the
neural network contains the information from
three consecutive timesteps. The auditory
information from the first layer gets relayed to
the second layer through a network of weights.
The value of a second layer artificial neuron is
where is the weight matrix, is the
input from the current timestep,
k
is the timestep input that appeared 12 ms ago,
and is the timestep input that
appeared 24 ms ago. Animals can only hear a very
limited range of frequencies. In this project,
neural network artificially simulates a limited
range of hearing between 0.172 and 5.512 kHz to
more accurately match the real world. Unsupervise
d training The neural network was trained on a
simple set of frequency-modulated (FM) sweeps and
pure tones. The model modified its own weights
according to Oja's rule after each presentation
of a timestep in the training set. Only one or
two artificial neurons were trained at one time
depending on the initial frequency of the
training stimulus. Moving ripples
The moving ripple stimuli are complex,
broadband noises that are used to determine the
STRFs of artificial neurons. They are composed of
hundreds of densely packed, log-spaced pure tones
that are sinusoidally modulated in the spectral
and temporal domains. The ripple equation is
given as where is intensity at
frequency-time points, is modulation
depth, is the ripple velocity (Hz), is
the ripple frequency (cycles/octave), and is
the phase shift (radians). These ripple stimuli
were varied across two parameters separately, the
ripple velocity (Hz) and the ripple frequency
(cycles/octave). The transfer function (TF) is a
broad characterization of an artificial neuron's
response to the various ripple stimuli and is
defined by where ,
is the response phase (radians), and
is the response magnitude. A
two-dimensional inverse Fourier transform
function was performed on the transfer function
in order to generate the desired STRF.
Purpose The aim of this project was to
investigate receptive fields on a neural network
to compare a computational model to the actual
cortical-level auditory processing. The receptive
fields are also analyzed against traditional
methods of characterizing neural models such as
tuning curves. Background Layout of the
ear The ear is the earliest stage of
auditory processing. The ear is divided into
three main areas the outer ear, the middle ear,
and the inner ear. Transduction, the process of
converting mechanical signals into electrical
potentials, takes place in the inner ear. The
vibrations in the inner ear selectively cause
hair cells along the basilar membrane in the
cochlea to move. The motion of the hair cells
allows electrical potentials to travel to the
auditory nerve and become processed by the brain.
Hair cells are theorized to be frequency-selective
specific pitches excite specific areas of the
basilar membrane. This layout of the ear makes it
convenient to represent sound as a function of
frequency and time, instead of a function of
pressure and time. Spectro-temporal receptive
fields (STRFs) STRFs represent the
linear properties of primary auditory processing
neurons and depict the neuronal impulse response
characterizations at frequency-time. STRFs are
generated by collecting a neuron's responses to
different moving ripple stimuli. Since these
stimuli are approximate components of complex
sounds, the STRFs characterize the neuron
response to spectro-temporally rich sound
stimuli. Since STRFs describe the neuronal
responses in both the spectral and temporal
dimensions, they are hypothesized to be more
useful than traditional methods of describing
neurons such as tuning curves. Tuning
curves Tuning curves have been used extensively
in both biological and computational applications
because they allow researchers to quantitatively
analyze the frequencies at which a specific
auditory neuron responds best. To generate these
curves, the neuronal response to pure tones
varied across the frequency domain are collected.
The maximum response to each tone was plotted in
a intensity vs. frequency plot, and the peak of
the plotted curve denotes the best frequency (BF)
of the artificial neuron. The neurons respond
with the greatest intensity to tones that match
their BF and with decreasing intensity to tones
away from their BF. Oja's rule Unsupervised
learning paradigms allow neural network models to
dynamically modify their own weighted connections
between nodes, analogous to the changes in
synaptic plasticity between neurons. Oja's rule,
one type of unsupervised learning algorithm, can
be shown as where represents
weight change between two units, is the
current weight, is the learning rate, and
and are the activation values of the
pre-synaptic and post-synaptic neurons,
respectively.
Figure 3. Schematic of neural network
Figure 1. The basilar membrane and
frequency-selectivity. Image taken from
www.hearingaidcentral.com
Figure 2. STRFs from Mexican free-tailed bats.
The image on the left shows the STRF from a
neuron with blocked inhibition and the image on
the right shows the STRF from a neuron with
inhibition. Image taken from Spectrotemporal
Receptive Fields in the Inferior Colliculus
Revealing Selectivity for Spectral Motion in
Conspecific Vocalizations by Andoni et al.
Recommended
CrystalGraphics Presentations


