Electrocardiography - PowerPoint PPT Presentation
1 / 26
Title:
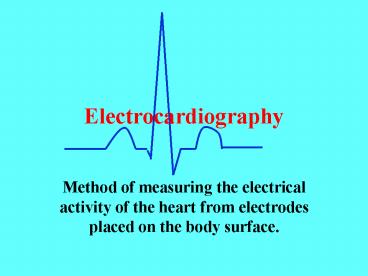
Electrocardiography
Description:
Electrocardiography Method of measuring the electrical activity of the heart from electrodes placed on the body surface. Heart Murmurs Echocardiography ... – PowerPoint PPT presentation
Number of Views:790
Avg rating:3.0/5.0
Title: Electrocardiography
1
Electrocardiography
- Method of measuring the electrical activity of
the heart from electrodes placed on the body
surface.
2
The heart becomes electrically polarized during
the cardiac cycle.
-
-
-
-
-
-
-
-
-
-
-
-
Atria Depolarized Ventricles not Depolarized
Atria Repolarized, Ventricles Depolarized
3
aVL
aVR
I
II
III
Electrocardiograph- instrument for measuring ECG
aVF
Electrocardiogram graphic recording of
electrical events of the heart.
4
(No Transcript)
5
- - - - - - -
Polarized
Heart Muscle Fiber
- - - - - - -
- - - - - - -
Depolarized
- - - - - - -
- - - - - - -
Repolarized
- - - - - - -
6
R
P
T
Q
S
P-R
Q-T
P-Wave Depolarization of Atria
QRS Depolarization of Ventricles
T-Wave Repolarization of Ventricles
P-R Interval Time for A.P. to pass from atria
to ventricles through A-V node.
Q-T Interval Time of ventricular contraction
7
12 Lead ECG
I
aVR aVL aVF
II
V1 V2 V3 V4 V5 V6
III
Guyton, p122, 1991
8
Tachycardia gt100 beats/min at rest
Normal
Tachycardia
Fever, Sympathetic Nerve Stimulation, weak heart
Guyton, p 139, 1991
9
Bradycardia lt 60 beats/min at rest
Normal
Bradycardia
Physical Training, Increased parasympathetic
stimulation
Guyton, p 139, 1991
10
Sinus Arrythmia
Small increases and decreases in heart rate
during the respiratory cycle.
Cardiotachometer records heart rate
Normal Breathing
Deep Breathing
Guyton, p139, 1991
11
Atrial Flutter
Atria contract 200-350/min
Normal
2-3 atrial/ventricular contraction
A.P.
12
Atrial Fibrillation
Uncoordinated contractions of atria
Normal
13
Ventricular Fibrillation
Uncoordinated contractions of ventricles
Normal
14
Electrical Defibrillation
Apply strong electrical shock across chest -
depolarize all fibers simultaneously - all in
refractory period same time. S-A node resumes
pacemaker role.
Normal
15
Premature Ventricular Contractions
PVCs
Impulse arises from hyperexcitable area (ectopic
focus) instead of S-A node.
Ectopic Focus
Sherwood Fig 7-8, 1995
Ischemia, caffeine, nicotine, anxiety
16
First Degree Heart Block
Delay in conduction from atria to ventricles -
increase in P-R interval.
Slow conduction across A-V node
Normal
Sherwood Fig 7-8, 1995
17
Second Degree Heart Block
Two or three P waves for every QRS
Impaired conduction
Normal
Sherwood Fig 7-8, 1995
18
Third Degree Heart Block
No relationship between P waves and QRS Atria
beat at one rate and ventricles at another
Blocked conduction
Normal
Sherwood Fig 7-8, 1995
19
Bundle Branch Block
Impairment of conduction of the impulse along one
of the bundle branches.
Blocked conduction
Sherwood Fig 7-8, 1995
20
Bundle Branch Block
Impairment of conduction of the impulse along one
of the bundle branches, causing prolonged
depolarization of the ventricle on that side.
Normal
LBB
21
Myocardial Infarction
Death of a region of heart tissue due to
inadequate supply of oxygen Heart Attack
Ischemia Insufficient blood supply to a region
of the heart.
Normal
22
Heart Sounds
1st Heart Sound Closure of A-V Valves
2nd Heart Sound Closure of Aortic and Pulmonary
Semilunar Valves
23
Heart Murmurs
Caused by leaky or stenotic heart valves.
Stenotic stiff and narrow - higher resistance
to flow causes swishing sound as blood is
forced through the smaller opening.
24
Echocardiography
Visualization of the heart using ultrasound.
Non-invasive technique for seeing the heart
beating in the thoracic cavity. Function of
valves can be seen nicely by this technique.
25
Left A-V Valve
26
Diastole
Systole


