
Catchment hydrology in PUBs: Model approaches and data sources - PowerPoint PPT Presentation
1 / 69
Title:
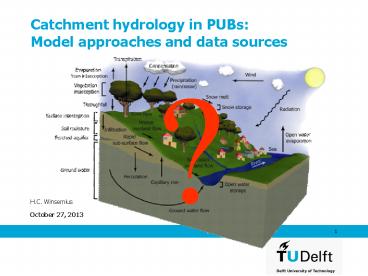
Catchment hydrology in PUBs: Model approaches and data sources
Description:
... projection to equal area Spatial modelling in PCRaster Distributed conceptual models Conceptual catchment models Water balance computation Routing Each cell ... – PowerPoint PPT presentation
Number of Views:524
Avg rating:3.0/5.0
Title: Catchment hydrology in PUBs: Model approaches and data sources
1
Catchment hydrology in PUBsModel approaches and
data sources
?
H.C. Winsemius
2
Reader
- Data sources
- Hydrologic static data (elevation, land cover)
- Dynamic data (meteo stations, satellite rain
estimates, runoff data centres, satellite-based
radiation) - Models, software (PCRaster, Open-source Numerical
Weather Prediction) - Everything mentioned is public domain and free of
charge
Introduction Model concepts Hydrological
data Exercise Synthesis
3
This lecture
- Emphasize more on the use of (sparse) data
- Conceptual modelling of catchments/river basins
- Point data
- Spatial data
- Exercise
- The retrieval of a Digital Elevation Model
- Derivation of hydrological variables from it
Introduction Model concepts Hydrological
data Exercise Synthesis
4
This lecture
- Basics of hydrologic modelling
- Why do we model?
- Modelling from processes to concepts
- What (public domain) data might be useful, how to
use it? - Introduction and demonstration of exercise
Introduction Model concepts Hydrological
data Exercise Synthesis
5
Why modelling
- There is no such thing as a perfect model.
- Choice of a certain type of model depends on the
question you want to answer / problem you want to
address - Choice of model depends on regional
hydro-climatology (which processes are dominant)
Introduction Model concepts Hydrological
data Exercise Synthesis
6
Why modelling
- To prove a hypothesis is wrong
- To extrapolate
- In time (for instance flood/drought forecasting)
- In space (Predictions in Ungauged Basins (IAHS
PUB adopt a model structure / parameterization
in a nearby ungauged area)
Introduction Model concepts Hydrological
data Exercise Synthesis
7
Typical modelling process
Forcing (Rainfall, potential evaporation)
Change
CONCEPTUAL MODEL
Discharge
Other observations
OK?
Apply model
Introduction Model concepts Hydrological
data Exercise Synthesis
8
What are hydrologic processes
Introduction Model concepts Hydrological
data Exercise Synthesis
9
What are we trying to learn?
10
Global Water Resources (stores and fluxes)
Atmosphere
Oceans and Seas
A
P
White
I
E
Blue
Surface
Water Bodies
Qs
Q
Qg
F
Deep Blue
Green
Soil
Renewable Groundwater
T
R
Introduction Model concepts Hydrological
data Exercise Synthesis
11
Perceptual modelwhat are the dominant processes?
Introduction Model concepts Hydrological
data Exercise Synthesis
12
Conceptual modelling
IN
OUT
Water balance check
e.g. Penman evaporation
e.g. Muskingum routing
Transfer
OUT
Introduction Model concepts Hydrological
data Exercise Synthesis
13
Conceptual modelling
- Catchment processes are mathematically described
(e.g. evaporation with the Penman-formula) - Storage is modelled as reservoirs (water
balance) - Model is applied over an area, draining towards a
specific river - Most hydrological models are more or less
conceptual
Introduction Model concepts Hydrological
data Exercise Synthesis
14
What is minimally needed for a catchment scale
hydrological analysis or model?
- Definition of drainage area (retrieved from
elevation information) - Hydrological forcing (Rainfall, potential
evaporation) - Rainfall is either (temporarilly) stored in a
catchment, will evaporate, or will be discharged
through a stream network - Potential evaporation is the maximum amount of
water that can evaporate from the land surface,
given the meteorological conditions and land
surface properties - A response of the catchment area (classically,
a hydrograph)
Introduction Model concepts Hydrological
data Exercise Synthesis
15
Simple model concept
Model concept
reality
Precipitation
(1-a)
Evaporation
a
S
Drainage area
Runoff
dS/dt a P(t)-Q(t)
Introduction Model concepts Hydrological
data Exercise Synthesis
16
From process to conceptual model
17
Check water balance (Storage change incoming
fluxes outgoing fluxes
IN
OUT
Water balance check
e.g. Penman evaporation
e.g. Muskingum routing
Transfer
OUT
Introduction Model concepts Hydrological
data Exercise Synthesis
18
Linear reservoir
Store
Flux
Parameter
I(t)
Q(t)
Introduction Model concepts Hydrological
data Exercise Synthesis
19
Linear reservoir
- Rising limb (tltte)
- Falling limb (tgtte)
Introduction Model concepts Hydrological
data Exercise Synthesis
20
Linear reservoir with threshold
I(t)
Q(t)
threshold
Introduction Model concepts Hydrological
data Exercise Synthesis
21
Concepts thresholds and reservoirs
Flux State
Radiation, humidity /etc.
Rainfall
Rainfall
Radiation, humidity /etc.
Interception
Interception
1-a
a
Transpiration
(Sub)surface flow
Transpiration
Unsaturated zone
(Sub)surface flow
River discharge
Percolation
Percolation
Base flow
Groundwater
Base flow
Perception
Model structure
22
Concepts unsaturated zone
Pn(t)
T(t)
Actual - Potential evaporation ratio
1
0,8
T/Ep
0,6
Fperc(t)c
0,4
0,2
0
0
0.25
0.5
0.75
1
FC
L
S/Smax
Introduction Model concepts Hydrological
data Exercise Synthesis
23
Calibration
- Tuning parameters on
- observed information
Discharge m3/s
Simulations Observations
Time
Introduction Model concepts Hydrological
data Exercise Synthesis
24
Calibration
- Example Luangwa river, Zambia
8000
7000
6000
5000
-1
s
3
4000
m
Q
3000
2000
1000
0
1/1/1980
5/1/1980
9/1/1980
1/1/1981
5/1/1981
9/1/1981
1/1/1982
5/1/1982
9/1/1982
1/1/1983
5/1/1983
Simulated
Observed
Introduction Model concepts Hydrological
data Exercise Synthesis
25
Sounds nice huh?
?
?
Introduction Model concepts Hydrological
data Exercise Synthesis
26
Data requirements
?
?
Flux State
Radiation, humidity /etc.
Rainfall
Rainfall
Radiation, humidity /etc.
Interception
Interception
1-a
a
Transpiration
(Sub)surface flow
Transpiration
Unsaturated zone
(Sub)surface flow
River discharge
Percolation
Percolation
Base flow
Groundwater
Base flow
Perception
Model structure
27
Hydrological information, how to use it? Where to
get it?
- Catchment delineation (based on elevation data)
- Inputs needed for potential evaporation (Net
radiation, temperature, wind speed, relative
humidity) - Rainfall
Introduction Model concepts Hydrological
data Exercise Synthesis
28
Lets assume that we have some meteorological
records
Radiation, humidity, temperature, wind speed ?
POTENTIAL EVAPORATION
Rainfall
- Relative humidity
- Temperature
- Wind speed
- Radiation
- Which we can use to estimate potential
evaporation - Crucial input for hydrological models (FAO,
Report 56)
Precipitation, meteorology
Evaporation
TB
Hydrological model
Discharge
Runoff
Introduction Model concepts Hydrological
data Exercise Synthesis
29
Interpolation methods Nearest Neighbour (a.k.a.
Thiessen polygons)
- Value in unknown point is assumed to be equal to
the value of the nearest observation
Introduction Model concepts Hydrological
data Exercise Synthesis
30
Interpolation methods inverse distance
- Value in unknown point is assumed to be equal to
the weighted average of surrounding observations
weighting is dependent on distance
Introduction Model concepts Hydrological
data Exercise Synthesis
31
What do our measurements tell us?
Introduction Model concepts Hydrological
data Exercise Synthesis
32
Interpolation methods inverse distance
Introduction Model concepts Hydrological
data Exercise Synthesis
33
Interpolation methods inverse distance
Introduction Model concepts Hydrological
data Exercise Synthesis
34
Intelligent interpolation
- How to cope with natural variability of land
surface - What influences local meteorology?
- How can we take into account these effects?
- Why do this?
elevation
Moisture evaporating
Air heating up
Dry fallow soil
Nicely wetted grass
Introduction Model concepts Hydrological
data Exercise Synthesis
35
Temperature with elevation correction
Slope lapse rate C m-1
Slope lapse rate C m-1
Introduction Model concepts Hydrological
data Exercise Synthesis
36
Net radiation
Top of atmosphere
Rs,ex
Gas, aerosols (t)
Rs,out
Rs,in
Rl,in
Rl,out
- Rn (1-a)Rs,inRl,in-Rl,out
- Rs,in Rs,ext
Surface (a)
Introduction Model concepts Hydrological
data Exercise Synthesis
37
Solar radiation in 2D
Top of atmosphere
zs Zenith angle Rs,surf Rs,in sin(zs)
Rs,in
Measurement instrument
zs
zs
Rs,in
surface
slope
Introduction Model concepts Hydrological
data Exercise Synthesis
38
Sun geometry (3D)
Source Chrysoulakis et al. (2004)
Introduction Model concepts Hydrological
data Exercise Synthesis
39
Example Wark catchment Luxembourg
Introduction Model concepts Hydrological
data Exercise Synthesis
40
Where to get data?
- Point data (meteorology, precipitation,
discharge) - Gridded data (precipitation, solar radiation)
- Static data (elevation, exercise)
Introduction Model concepts Hydrological
data Exercise Synthesis
41
Data sources for point / gridded data
- Wide collection of global data sources (see
reader) - Monthly in-situ rainfall / temperature data
(mostly old data) - http//climexp.knmi.nl
- Tries to assemble many (point) data sources
- Global Historical Climatology Network
- RivDis
- Overview of gridded observations / (re)analyses /
climate forecasts - !!! If you want to share data! Uploads are also
possible !!!
Introduction Model concepts Hydrological
data Exercise Synthesis
42
Satellite based rainfall estimates
- Usually a combination of several satellite
estimates (performance dependent on event-type) - Combined by weights, determined by comparing with
ground stations - Blended with ground stations for bias correction
- !!! This means that remote sensing does not make
ground measurements redundant, they have to be
used in combination !!!
Introduction Model concepts Hydrological
data Exercise Synthesis
43
FEWS (early warning) rainfall estimates,
forecasts
44
What about radiationon larger scales?
Top of atmosphere
Gasses, aerosols (t)
- Remote sensing METEOSAT
Rs,out
Rs,in
Rl,in
Rl,out
Surface (a)
Introduction Model concepts Hydrological
data Exercise Synthesis
45
Weather prediction
Discharge m3/s
- Predictions into the future
- Numerical weather prediction
Time
Top of atmosphere
Now!
evaporation
rainfall
Boundary conditions
Boundary conditions
Introduction Model concepts Hydrological
data Exercise Synthesis
46
Elevation http//seamless.usgs.gov
47
Exercises
- Retrieve a Digital Elevation Model (DEM) from
internet - Project it to equal area
- Do some hydrological analysis on it
- Pit and missing value filling
- Flow directions
- Catchment derivation
Introduction Model concepts Hydrological
data Exercise Synthesis
48
Exercise downloading DEM
Download box
x / y selection
49
Exercise downloading DEM
50
Exercise downloading DEM
51
Exercise projecting to equal area
- What is projection?
projection
52
Exercise projection to equal area
- Projection parameters
- Projection type (in this case Lambert Azimuthal
Equal Area) - Center point
- Geoid (i.e. radius of the earth), usually WGS84
- Map extent
- Map resolution
53
(No Transcript)
54
Spatial modelling in PCRaster
E
P
P
E
P, E
P, E
E
P
P, E
P, E
Semi-distributed
Distributed
Lumped
Introduction Model concepts Hydrological
data Exercise Synthesis
55
Distributed conceptual models
Runoff accumulated
Introduction Model concepts Hydrological
data Exercise Synthesis
56
Conceptual catchment modelsWater balance
computation
Introduction Model concepts Hydrological
data Exercise Synthesis
57
Routing
- Each cell has
- Input (e.g. rainfall)
- Stores (e.g. soil
- moisture, groundwater level)
- Output (e.g. evaporation, runoff)
- Even groundwater outflow goes straight to the
river - Where does the runoff go?
Introduction Model concepts Hydrological
data Exercise Synthesis
58
Routing
- Runoff moves horizontally over the drainage
network - Transport in a cell without storage consideration
is - where
- n location of upstream cell
- i location cell under computation
- n 0 the location of a water divide
Introduction Model concepts Hydrological
data Exercise Synthesis
59
Example Kabompo basin, Zambia
60
FEWS rainfall projection
Raw and packed FEWS data
PCRaster input series
Projection / conversion tool Day_FEWS_tiff
61
Synthesis
- Predictions in space?
Precipitation, meteorology
TB
Introduction Model concepts Hydrological
data Exercise Synthesis
62
Temperature and windMETEOLOOK concept
- Spatial variability in temperature is primarily
caused by - Elevation
- Distance to sea
- Radiation
- Land use
- Wetness
63
- Vegetation ?Twetness
- DEM ?Televation
- Rs,in ?Tradiation
64
Temperature and wind
- Near surface, temperature and wind are strongly
influenced by surface characteristics - At 100 m height, temperature and wind are not
significantly influenced by surface
characteristics
65
Temperature and wind profiles
T100m
T100m
u100m
u100m
Tmeas
umeas
ucalc
Tcalc
66
Temperature and wind
- Near surface, temperature and wind are strongly
influenced by surface characteristics - At 100 m height, temperature and wind are not
significantly influenced by surface
characteristics
67
What happens at mixing height (100 m)?
- Temperature (and wind) depend on
- Elevation
- Incoming radiation
- Distance to sea
- Parameters can be defined by user
68
T0
T0 residual temperature 100m surface,
corrected for elevation, radiation and distance
to sea
Distribute T0 with geostatistical approach (e.g.
inverse distance)
69
T0, u0
T0, u0
T0, u0
z 100 m
T0, u0
T0, u0
Tmeas, umeas
Tmeas, umeas
z
Tmeas, umeas
Tmeas, umeas
Tmeas, umeas
Recommended
CrystalGraphics Presentations


