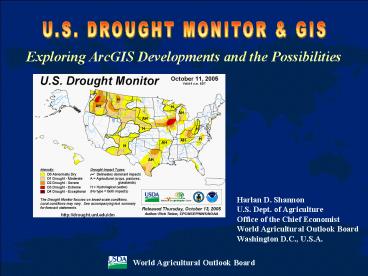
U'S' DROUGHT MONITOR - PowerPoint PPT Presentation
1 / 46
Title:
U'S' DROUGHT MONITOR
Description:
World Agricultural Outlook Board. U.S. DROUGHT MONITOR & GIS. Harlan D. Shannon ... Washington D.C., U.S.A.. Exploring ArcGIS Developments and the Possibilities ... – PowerPoint PPT presentation
Number of Views:25
Avg rating:3.0/5.0
Title: U'S' DROUGHT MONITOR
1
U.S. DROUGHT MONITOR GIS
Exploring ArcGIS Developments and the
Possibilities
Harlan D. Shannon U.S. Dept. of
Agriculture Office of the Chief Economist World
Agricultural Outlook Board Washington D.C., U.S.A.
2
U.S. DROUGHT MONITOR GIS
Introduction
- ArcGIS version of the USDM
- Benefits of using GIS
- WAOB product development
- Future work
3
U.S. DROUGHT MONITOR GIS
Similar to CorelDraw, ArcGIS has solid vector
drawing capabilities
4
U.S. DROUGHT MONITOR GIS
5
U.S. DROUGHT MONITOR GIS
6
U.S. DROUGHT MONITOR GIS
7
U.S. DROUGHT MONITOR GIS
8
U.S. DROUGHT MONITOR GIS
9
U.S. DROUGHT MONITOR GIS
10
U.S. DROUGHT MONITOR GIS
In contrast to CorelDraw, ArcGIS offers spatial
analysis tools
11
U.S. DROUGHT MONITOR GIS
12
U.S. DROUGHT MONITOR GIS
13
U.S. DROUGHT MONITOR GIS
ArcGIS also offers georeferencing capabilities
14
U.S. DROUGHT MONITOR GIS
15
U.S. DROUGHT MONITOR GIS
16
U.S. DROUGHT MONITOR GIS
17
U.S. DROUGHT MONITOR GIS
18
U.S. DROUGHT MONITOR GIS
19
U.S. DROUGHT MONITOR GIS
20
U.S. DROUGHT MONITOR GIS
21
U.S. DROUGHT MONITOR GIS
ArcGIS scripting capabilities ensure product
continuity
22
U.S. DROUGHT MONITOR GIS
23
U.S. DROUGHT MONITOR GIS
Benefits of using GIS
- GIS benefits extend well beyond facilitating USDM
creation each week - Many individuals, institutions, organizations,
and agencies use GIS - GIS shapefiles easily distributable
- Underlying spatial data enables the quantitative
analysis of drought
24
U.S. DROUGHT MONITOR GIS
WAOB Product Development
Product 1
25
U.S. DROUGHT MONITOR GIS
WAOB Product Development
Product 1
26
U.S. DROUGHT MONITOR GIS
WAOB Product Development
Product 2
27
U.S. DROUGHT MONITOR GIS
WAOB Product Development
Product 2
28
U.S. DROUGHT MONITOR GIS
WAOB Product Development
Product 2
29
U.S. DROUGHT MONITOR GIS
WAOB Product Development
Product 3
30
U.S. DROUGHT MONITOR GIS
WAOB Product Development
Product 3
31
U.S. DROUGHT MONITOR GIS
Future Work
- Improve methodology for creating USDM weekly
- Convert more drought indices into GIS-compatible
format - Create/update shapefile metadata
- Make GIS data available for public distribution
32
U.S. DROUGHT MONITOR GIS
33
U.S. DROUGHT MONITOR GIS
34
U.S. DROUGHT MONITOR GIS
35
U.S. DROUGHT MONITOR GIS
36
U.S. DROUGHT MONITOR GIS
Future Work
- Improve methodology for creating USDM weekly
- Convert more drought indices into GIS-compatible
format - Create/update shapefile metadata
- Make GIS data available for public distribution
37
U.S. DROUGHT MONITOR GIS
Future Work
38
U.S. DROUGHT MONITOR GIS
Future Work
- Improve methodology for creating USDM weekly
- Convert more drought indices into GIS-compatible
format - Create/update shapefile metadata
- Make GIS data available for public distribution
39
U.S. DROUGHT MONITOR GIS
40
U.S. DROUGHT MONITOR GIS
Future Work
- Improve methodology for creating USDM weekly
- Convert more drought indices into GIS-compatible
format - Create/update shapefile metadata
- Make GIS data available for public distribution
41
U.S. DROUGHT MONITOR GIS
42
U.S. DROUGHT MONITOR GIS
Exploring ArcGIS Developments and the
Possibilities
Thank you!
43
(No Transcript)
44
U.S. DROUGHT MONITOR GIS
ArcGIS Version of the USDM
- In May 1999, USDM introduced as an experimental
CorelDraw generated product - CorelDraw provided the capability to draw vector
graphics, add annotation, and export maps in
various formats - Following a short period of developing several
map iterations, USDM authors settled on a format
which has remained relatively consistent to date
45
U.S. DROUGHT MONITOR GIS
ArcGIS Version of the USDM
- In March 2003, ArcGIS version of the USDM product
ready for distribution - In August 2003, USDM introduced as an operational
ArcGIS product - Steep learning curve made initial implementation
of the ArcGIS product challenging - Since mid-October 2003, ArcGIS version of the
USDM operational
46
U.S. DROUGHT MONITOR GIS
WAOB Product Development
Product 3


