
Math Jeopardy - PowerPoint PPT Presentation
1 / 51
Title:
Math Jeopardy
Description:
columns of x's above a number line to show data. A line plot ... Hours Watching Television on Nov. 11th. X X. X X X X X. X X X X X. X X X X X ... – PowerPoint PPT presentation
Number of Views:71
Avg rating:3.0/5.0
Title: Math Jeopardy
1
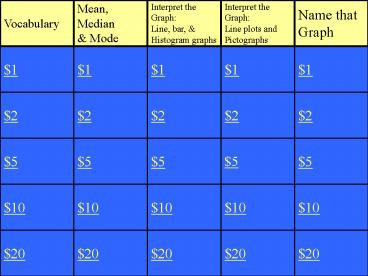
Vocabulary
Mean, Median Mode
Interpret the Graph Line, bar, Histogram
graphs
Interpret the Graph Line plots
and Pictographs
Name that Graph
1
1
1
1
1
2
2
2
2
2
5
5
5
5
5
10
10
10
10
10
20
20
20
20
20
2
What is a collection of information?
3
Data
4
A graph that shows data by using picture symbols
is called what?
5
A pictograph
6
The number that occurs most often in a set of
data is called what? Mean, Median, or Mode
7
Mode
8
A graph that uses one or more line segment to
show changes in data is called what?
9
Line graph
10
A bar graph that shows the frequencies of data
within equal intervals is what type of graph?
11
Histogram graph
12
What is the mode of this set of data? 41, 25, 30,
6, 41
13
The mode is 41
14
What is the mean of this set of data? 25, 36, 42,
62, 12
15
The mean is 35.4
16
Find the median 56, 12,
14, 16, 24
17
The Median is 16
18
What is the mode for this set of data14, 20,
15, 23, 24
19
There is no mode
20
What is the mode for this set of data? 14, 14, 5,
9, 8, 5
21
The mode is 14 and 5
22
Which player scored the most points?
23
Nicole
24
What type of graph is shown below?
25
A bar graph
26
Who scored the least points?
27
Hunter
28
Between which two weeks were there the greatest
increase in height?
29
Weeks 1 and 2
30
What type of graph is shown below?
31
A line graph
32
A vertical graph that uses columns of xs above
a number line to show data
33
A line plot
34
How many students watched 4 hours of T.V.?
- Hours Watching Television on Nov. 11th
- X X
- X X X X X
- X X X X X
- X X X X X
- 0 1 2 3 4 5 or more hrs.
35
Zero students watched 4 hours of T.V.
36
How many students watch one hour of TV.?
- Hours Watching Television on Nov. 11th
- X X
- X X X X X
- X X X X X
- X X X X X
- 0 1 2 3 4 5 or more hrs.
37
4 students watch one hour of TV
38
What type of graph is shown below?
- Favorite crayon color
- Crayon colors Number of Students
- Red
- Blue
- Green
- Key 5 students
39
A pictograph
40
What is the most favorite crayon color?
- Favorite crayon color
- Crayon colors Number of Students
- Red
- Blue
- Green
- Key 5 students
41
Red is the most favorite crayon color
42
What graph should be used if you want to use
pictures to represent your data?
43
A pictograph
44
What graph should be used for this set of data?
- 1.50-3.49
- 3.50-5.49
- 5.50-7.49
- 7.50-9.49
- 9.50-11.49
45
A Histogram
46
What graph should be used for this set of data?
- Temperature data
- Time data
- Data using months or days
- Data that shows changes over time
47
Line graph
48
What graph uses Xs to represent data?
49
A line plot
50
Shown below is a collection of data about the
height of students in a certain classroom. What
type of graph would you use for this data?
- Height (cm) Frequency
- 150-154 2
- 154-158 4
- 158-162 6
- 162-166 4
- 166-170 4
- 170-174 7
- 174-178 4
51
A histogram
Recommended
CrystalGraphics Presentations


