
Central Tendency - PowerPoint PPT Presentation
1 / 44
Title:
Central Tendency
Description:
The mean of a data set is the sum of the observations divided by the ... A mode may also be meaningfully obtained. Anthony J Greene. 5. Mean, Median and Mode ... – PowerPoint PPT presentation
Number of Views:40
Avg rating:3.0/5.0
Title: Central Tendency
1
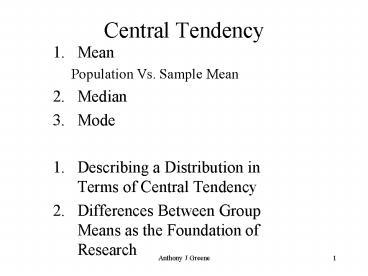
Central Tendency
- Mean
- Population Vs. Sample Mean
- Median
- Mode
- Describing a Distribution in Terms of Central
Tendency - Differences Between Group Means as the Foundation
of Research
2
Mean, Median and Mode
- The mean of a data set is the sum of the
observations divided by the number of
observations. The arithmetic average - The median is the middle point of a distribution.
The 50th ile - The mode is the most frequently occurring score
3
Mean, Median and Mode
- Nominal or Categorical Variables. One cannot
average categories or find the midpoint among
them. Since categorical variables do not allow
mathematical operations, only the mode can be
used as a central tendency for categorical
variables.
4
Mean, Median and Mode
- Ordinal Variables
- Since ordinal variables are ordered a midpoint or
median may be obtained, but because the intervals
are not even, the arithmetic average cannot be
used. - A mode may also be meaningfully obtained.
5
Mean, Median and Mode
- Interval and Ratio Variables.
- Because interval and ratio scales are evenly
distributed, a mean may be obtained. - Median and Mode may also be obtained. Median may
be preferable when the distribution is skewed.
6
Mean, Median and Mode
- Nominal / Categorical Mode only
- Ordinal Median and Mode
- Interval and Ratio Mean, Median and Mode
7
Mean
The mean of the population of a discrete random
variable X is denoted by m x or, when no
confusion will arise, simply by m. It is defined
by Where N is the population size The terms
expected value and expectation are commonly used
in place of mean.
8
- A population of N 6 scores with a mean of ?
4. - The mean does not necessarily divide the scores
into two equal groups. - In this example, 5 out of the 6 scores have
values less than the mean.
9
The mean as the balance point
A distribution of n 5 scores with a mean of µ
7.
10
The mean as the balance point
11
Mean
12
Some New Notation
Statistics quiz scores for a section of n 8
students.
13
Some New Notation
f
or
10 9 9 8 8 8 8 6 66 Or 10 18
32 0 6 66
14
Population Versus Sample Mean
15
Sample Mean
- For a variable x, the mean of the observations
for a sample is called a sample mean and is
denoted M. Symbolically, we have - where n is the sample size.
16
Samples and Populations
- Parameter A descriptive measure for a
population. - Statistic A descriptive measure for a sample
17
Samples and Populations
M
Statistics
Parameters
18
M
19
Data Transformations
Measurement of five pieces of wood.
20
Data Transformations
Day F C
Mon 58 14.4
Tues 62 16.7
Wed 68 20
Thurs 75 23.9
Fri 56 13.3
Sat 51 10.6
Sun 63 17.2
Average 61.9 16.6
- Whether in Fahrenheit or Celsius, the information
is identical. - For this transformation C (F-32)(5/9)
- In GeneralWith ratio and interval scales you
can - Add or subtract a constant
- Multiply or divide by a constant
21
Median
- The median is the middle score or the 50th ile.
- Thus half the scores occur above the mean, and
half occur below the mean. - Could the mean and the median be different? If
so, why?
22
The median divides the area in the graph in half
23
Median
- Arrange the data in increasing order.
- If the number of observations is odd, then the
median is the observation exactly in the middle
of the ordered list. - If the number of observations is even, then the
median is the mean of the two middle observations
in the ordered list. - In both cases, if we let n denote the number of
observations, then the median is at position (n
1)/2 in the ordered list.
24
The median divides the area in the graph exactly
in half.
25
The median divides the area in the graph exactly
in half.
26
The First Trick About MediansDealing With an
Even Number of Scores
121 124 126 129 135 191
In this Simple Case, simply take the mean of the
two middle scores, 127.5
27
The Second Trick About MediansWhat Happens When
There Are Several Instances of the Middle Score
The most basic rule is that there have to be as
many above the median as below, in this case 5
28
A Direct Comparison of Mean and Median
- Consider a sample of three scores 5, 7, 9
- Mean and Median are identical
- Consider a second sample 5, 7, 28
- Mean is affected, median is not
- Median is insensitive to extreme scores.
- When the mean and median differ, the
distributions is skewed.
29
Mode
- Obtain the frequency of occurrence of each value
and note the greatest frequency. - If the greatest frequency is 1 (i.e., no value
occurs more than once), then the data set has no
mode. - If the greatest frequency is 2 or greater, then
any value that occurs with that greatest
frequency is called a mode of the data set.
30
Mode Favorite restaurants
31
Describing Distributions by Central Tendency
Not a naturally occurring distribution
- Mean, Median and Mode are identical
32
Describing Distributions by Central Tendency
- No Mode
33
Describing Distributions by Central Tendency
- Mode is the lowest or highest score
34
Describing Distributions by Central Tendency
- Median and Mean are different For right skewed
the median is lower than the mean, for left
skewed, the median is higher than the mean.
35
Describing Distributions by Central Tendency
- More than one Mode.
36
Describing Distributions by Central Tendency
37
The Basic Idea of Experimental Design
- Are two (or more) means different from one
another? e.g., experimental vs. control group.
38
Differences Between Means Maze Learning
39
The mean number of errors made on the task for
treatment and control groups according to gender.
40
Amount of food (in grams) consumed before and
after diet drug injections.
41
The relationship between an independent variable
(drug dose) and a dependent variable (food
consumption). Because drug dose is a continuous
variable, a continuous line is used to connect
the different dose levels.
42
The Basic Idea of Experimental Design
- Are two (or more) means different from one
another e.g., experimental vs. control group. - Remember that the means will always differ
somewhat by chance factors alone. - In the next chapter we will explore how to
measure the spread of a variable which,
ultimately, will be the basis for understanding
how far apart means must be to not be
attributable to chance factors
43
Significant Differences?
µ1 40 µ260
44
Significant Differences?
µ1 40
µ260
Recommended
CrystalGraphics Presentations


