
The Freeze Thaw as a Deterioration Mechanism - PowerPoint PPT Presentation
1 / 32
Title:
The Freeze Thaw as a Deterioration Mechanism
Description:
... to better understand freeze thaw cycling in order to prevent the ... According to this data, 20 days in February have the potential for freeze thaw cycling ... – PowerPoint PPT presentation
Number of Views:499
Avg rating:3.0/5.0
Title: The Freeze Thaw as a Deterioration Mechanism
1
The Freeze Thaw as a Deterioration Mechanism
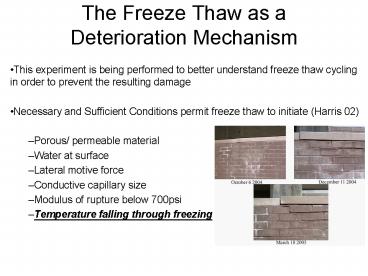
- This experiment is being performed to better
understand freeze thaw cycling in order to
prevent the resulting damage - Necessary and Sufficient Conditions permit freeze
thaw to initiate (Harris 02) - Porous/ permeable material
- Water at surface
- Lateral motive force
- Conductive capillary size
- Modulus of rupture below 700psi
- Temperature falling through freezing
2
Temperatures Falling Through Freezing
- This is the specific necessary and sufficient
condition we are trying to better understand - Our preliminary investigation suggested a
relationship between surface temperatures and air
temperatures - This is a function of several conditions such as
- The amount of solar radiation, atmospheric
condition, time of year, time of day etc - This suggests that, in reality, building surfaces
experience a greater number of freeze thaw cycles
than is recorded by the monthly data.
3
Average Temperatures in February for Akron, Ohio
2004
Monthly Data
Daily Data
- Average Max. Temperature (35.9)
- Average Min. Temperature (18.9)
- According to average data, everyday in February
has the potential for freeze thaw cycling because
air temperature fluctuated above and below
freezing everyday
- 20 days where the max. and min. temperature
fluctuates above and below freezing - According to this data, 20 days in February have
the potential for freeze thaw cycling
4
Preliminary Investigation of Taylor Hall
- Two preliminary trials of surface temperature
readings were taken during an overcast day and a
clear day. - On a clear day, the temperatures on the South and
West surfaces generally were higher than on the
North and East. - On the overcast day, all surface temperatures
remained around or below the outdoor air
temperature. - This suggests that surface temperatures vary with
orientation.
- Taylor Hall, Preliminary Trial
- Materials Tested
- Dark Brick e(0.93)
- Concrete e(0.85)
- Railing, Black Paint e(0.84)
North South
East West
5
Actual Number of Potential Freeze Thaw Cycles
- According to the data collected from Taylor hall,
the South and West façade materials have the
potential to experience freeze thaw cycling on
clear day conditions. - Therefore, the potential number of freeze thaw
cycles may be dictated by solar radiation. - How can we reduce the number of freeze thaw
cycles? - Can we decrease the surface temperatures to
reduce the number of freeze thaw cycles?
6
Hypotheses
- The North and East surfaces will experience fewer
temperature fluctuations (temperatures falling
through freezing) than the South and West
surfaces. - We can reduce the temperature fluctuation on the
South and West surfaces through the application
of shading devices, decreasing their surface
temperatures and thus reducing the potential
number of freeze thaw cycles.
7
Methods of Testing
- One week- surface temperatures at Barberton
- Use Accurite digital thermometer to measure daily
surface temperature of the North, East, South and
West walls at various times of the day - Continued three week- surface temperatures at
Barberton - Use Accurite thermometer to measure daily MAXIMUM
and MINIMUM surface temperatures on the North,
East, South, and West walls. - Ecotect simulation of solar radiation on building
surfaces - Determine the effects of adding a shading device
to the building surfaces - Cast plaster of Paris physical model simulating
sun movement - Use Accrurite digital thermometers cast within
the material and affixed to exterior surfaces to
measure surface temperature - Use a light source, steriographic diagram
F
next
8
Barberton Residence
- One story residence with basement
- 60 (East and West surfaces)
- 40 (North and South surfaces)
9
Barberton Elevations
North façade, neighboring 2 story house
East façade, facing street
South façade, neighboring 1 story house
West façade, sparse deciduous
10
Barberton Floor Plan
11
Barberton Clear Day Condition
- North wall has least fluctuation- West and South
has greatest fluctuation - Drastic increase in all surface temperatures as
a result of clear day conditions at 300 - West wall was coolest in morning and night
- During morning, all surface temperatures near
air temperature - All temperatures are above freezing, shading
device not needed
12
Barberton Surface Temp Trend
- Surface temperatures follow air temperature
unless influenced by solar radiation
13
Barberton Ideal Conditions for Added Shading
Device
- This day was all overcast with day ending with
rain - Surface temperatures are near or around air
temperature - North wall was above air temperature because of
interior treated air - Maximum air temperature is very close to
freezing - Since surface temperatures will fluctuate with
air temperature, the ideal condition is when all
maximum surface temperatures are above maximum
air temperature and maximum air temperature is
below freezing.
14
Ecotect North Wall
- Insolation levels were the lowest of all
surfaces - Agreed with the hypothesis that the North wall
will receive the lowest amount of solar radiation - It was assumed that the surface temperature
would also be low - Using a shading device indicated little to no
change
15
Ecotect East Wall
- Consistent with hypothesis derived from Taylor
Hall preliminary investigation - Evidenced an overall high level of solar
radiation - Shading device significantly decreased the level
of overall insolation
16
Ecotect South Wall
- Results also support the hypothesis, surface
with the highest level of insolation - Indicates the greatest fluctuation in incident
solar radiation received on the surface- reaches
each extreme - Added shading, the surface will receive little
to no solar radiation during clear day
conditions, thus, reducing fluctuation in surface
temperature - Great potential to reduce the number of freeze
thaw cycles
17
Ecotect West Wall
- West wall will have more incident solar
radiation than the North and East - Solar radiation was reduced by adding a shading
device- reaches both extremes, great potential to
reduce the number of freeze thaw cycles - The East and West side of a building receive
equal amount of sunlight for half a day
the West side will be slightly warmer than the
East side because of the combination of solar
radiation and higher afternoon air temperatures.
- (Mazria 91)
18
Physical Model Construction
- 18 x 10 x 8, ¾ thick model formed with
Styrofoam insulation and plaster of Paris - Two Accurite thermometers cast within each wall
halfway down and one placed on each surface
corresponding to Barberton locations - Plotted map of sun positions during the week
tested in February to locate lamp position using
the corresponding azimuth, altitude, and time of
day
19
Physical Model 3D Sun Map
- Map of sun positions
- Location of thermometers
20
Physical Model without Shade
Test position 1210 PM Altitude 9-3/4
- Lamp continuously follows path of the sun, from
morning to night, simulating a typical day during
the one week tested in February - Lamp kept in each position for 10 minutes
- When finished, model was allowed to cool back to
room temperature
Test position 350 PM Altitude 6-3/4
21
Physical Model with Shade
Test position 850 AM Altitude 4-3/4
- Shades constructed of Styrofoam
- Provided shade on the majority of the surface
- Same testing procedure performed as without
shading devices - Shading devices on all four sides
Test position 350 PM Altitude 6-3/4
22
Physical Model with Hotplate
- Hot plate isolated to North wall simulating the
treated air condition at Barberton - Insulation used to separate the model in two
distinct zones - North zone enclosed with an Styrofoam roof
- Conclusion indicated that surface temperatures
on North wall was significantly higher than the
other surfaces, similar to that indicated at
Barberton
23
Physical Model Results Without Shading Device
- The model resulted in similar patterns as
expected from hypotheses - Similarities could also be made between the
actual clear day condition, 02-15-05 - South wall increases at noon
- East wall peaks in morning hours
- West wall increases through the day, peaks in
evening - North wall remains lowest, shaded condition, and
is relatively constant
24
Physical Model with Shading/Hotplate
- All surfaces were able to be maintained with no
fluctuation - North wall had no change after adding shading
device - All surfaces temperatures did behave in the same
manner as un-shaded but, once shaded the
fluctuation was minimal
- All surfaces followed the same patterns as in
previous tests except for the north wall - The added hot plate kept the North surface
temperature considerably higher than the others - As the others declined, the North maintained a
higher temperature - Similar to night condition at Barberton
25
General Assumption
- The North and East surfaces will experience fewer
temperature fluctuations (temperatures falling
through freezing) than the South and West
surfaces.
Actual Number of Fluctuations at Barberton from
February 14th to March 10th North surface 13
? South surface 18 Air Temperature 11 East
surface 19 West surface 19
26
Hypothesis
- We can reduce the temperature fluctuation on the
South and West surfaces through the application
of shading devices, decreasing their surface
temperatures and thus reducing the potential
number of freeze thaw cycles. - If solar radiation It0, then surface temperature
Ts air temp To
Example 1 February 14th at 900 AM for the East
surface q/A (aIt) (ho(to-ts) -
(eDR) Calculation 1 Solving for heat flux under
current condition q/A (0.8x26)3(46.7-45.9)-(
0) q/A 23.2 Therefore, area 200 sq.ft.
q (23.2 Btu/h.sq.ft.)(200 sq.ft.) q 4640
Btu/h Determining sol-air temperature, te to
(aIt)/ ho - (eDR)/ ho te 46.7
(0.8)(26)/3-(0/3) te 53.63 degrees
Fahrenheit Calculation 2 solving for surface
temperature by eliminating incident solar
radiation - ((q/A) (aIt) (eDR)) / ho ) to
ts - ((4640-(0.8)(26)) 0) / 3) 46.7
28.97 degrees Fahrenheit
27
Hypothesis
- Surface temperature will be air temperature when
solar radiation is zero
We can potentially reduce the actual number of
freeze thaw cycles from 13 to 1
28
Hypothesis
- Surface temperature will be air temperature when
solar radiation is zero
We can potentially reduce the actual number of
freeze thaw cycles from 19 to 6
29
Hypothesis
- Surface temperature will be air temperature when
solar radiation is zero
We can potentially reduce the actual number of
freeze thaw cycles from 18 to 5
30
Hypothesis
- Surface temperature will be air temperature when
solar radiation is zero
We can potentially reduce the actual number of
freeze thaw cycles from 19 to 8
31
Future Possibilities
- Through design, we can reduce the damage that
results from deterioration mechanisms - We may be able to design intelligent environments
that respond to specific freeze thaw conditions
that change with the temperatures and seasons
such as removable or retractable shading device - This may allow us to better understand
deterioration mechanisms and the energy that they
produce. - Through understanding the energy of these
mechanisms, we may potentially be able to design
architectural systems to harness that energy. - Perhaps deterioration can be viewed as a benefit
as opposed to a negative impact or negotiated
circumstance.
32
Hypotheses
- The North and East surfaces will experience fewer
temperature fluctuations (temperatures falling
through freezing) than the South and West
surfaces. - We can reduce the temperature fluctuation on the
South and West surfaces through the application
of shading devices, decreasing their surface
temperatures and thus reducing the potential
number of freeze thaw cycles.
Recommended
CrystalGraphics Presentations


