Linear Regression Analysis - PowerPoint PPT Presentation
1 / 13
Title:
Linear Regression Analysis
Description:
... tool for the investigation of relationships between variables. ... The following process find a sample regression line that best fits the sample of ... – PowerPoint PPT presentation
Number of Views:20
Avg rating:3.0/5.0
Title: Linear Regression Analysis
1
Linear Regression Analysis
- Paskorn _at_ DssG
2
Regression Analysis
- Regression analysis is a statistical tool for the
investigation of relationships between variables. - E.g, the effect of a price increase to demand
- The relationship between the mean value of a
random variable (e.g., product sales) and the
corresponding values of one or more independent
variables (e.g. promotion expenditures).
sales
Promotion expenditure
3
Regression Analysis Techniques
- There are several regression analysis models.
- simple linear regression model
- 1 random variable.
- 1 independent variable.
- multiple linear regression model
- 1 random variable (e.g., product sales).
- Many independent variables (promotion
expenditure, product color) - Nonlinear model
- The relationship of a random variable and
independent variables is not linear.
4
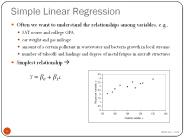
Simple Linear Regression Model
- The most common form of estimation equation in
regression analysis is a linear relationship
between a random variable and an independent
variable.
Y a ßX
Y dependent (random) variable a interception
on Y-axis ß slope
5
Assumptions
- Assumption 1 The value of the dependent variable
Y is claimed to be a random variable, which is
dependent on fixed (non random) values of the
independent variable X - Assumption 2 A theoretical straight-line
relationship exists between X and the expected
value of Y ( E(Y) )for each of the possible
values of X.
6
yi yi ei
yi theoretical value
yi a ßxi ei
ei error
E(e) 0
a
yi observed value
7
Estimating the Population Regression Coefficients
- The population regression coefficients a and ß
are estimated by using n pairs (population) of
observations (x1,y1),(x2,y2) (xn,yn) - The following process find a sample regression
line that best fits the sample of observations
(the number of observations is less than the
number of population) - The sample estimates of a and ß can be
represented as a and b respectively.
yi a bxi
8
Finding a and b
- The process to find a and b is called ordinary
least square (OLS) process method. - This OLS minimize the sum of the squares of
errors.
9
(No Transcript)
10
(No Transcript)
11
(No Transcript)
12
Example
13
(No Transcript)
Recommended
CrystalGraphics Presentations