
Stochastic Simulations - PowerPoint PPT Presentation
Title:
Stochastic Simulations
Description:
Stochastic Simulations – PowerPoint PPT presentation
Number of Views:36
Avg rating:3.0/5.0
Title: Stochastic Simulations
1
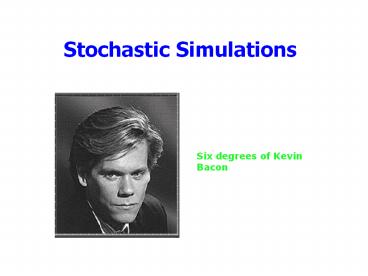
Stochastic Simulations
Six degrees of Kevin Bacon
2
Outline
- Announcements
- Homework II due Today. by 5, by e-mail
- Discuss on Friday.
- Error on p.3
- t(jjn) should be t(jjn-1)
- fixed on web
- Homework III on web
- Basins Example
- Monte Carlo Simulations
- Random Numbers
- Example--Small Worlds
3
Example Temp. on NW Atlantic Shelf
- Data consist of yearly mean temperatures between
150-250m depth from 4 locations on NW Atlantic
Shelf - Are the temps independent?
- Example is on web
- Work it through on your own
- PS3 will contain a question from this example!
Jordan Basin
Emerald Basin
Wilkinson Basin
Georges Basin
4
Monte Carlo
- Monte Carlo methods refer to any procedure that
uses random numbers - Monte Carlo methods are inherently statistical
(probabilistic) - Used in every field
- Galaxy formation
- Population model
- Economics
- Computer algorithms
5
Monte Carlo Example
- Have a computer model which computes price of
corn in Omaha using rainfall. - You have a forecast of rainfall for next few
months from NWS - Forecast is rain /- SE
- How can you incorporate uncertainty of rainfall
into your forecast of prices? - Want /- SE
6
Monte Carlo Example
- 1. Create several random forecast rainfall series
- mean of the series is the forecast
- SE of series is the forecast SE
- 2. Compute prices
- 3. Calculate SE of prices.
7
Random Numbers
- Computers are deterministic
- Therefore, computers generate pseudo-random
numbers - Matlabs random numbers are good
- The uniform random number generator in MATLAB 5
uses a lagged Fibonacci generator, with a cache
of 32 floating point numbers, combined with a
shift register random integer generator. - http//www.mathworks.com/support/solutions/data/85
42.shtml
8
Random functions
- rand(m,n) produces m-by-n matrix of uniformly
distributed random numbers 0,1 - randn(m,n) produces random numbers normally
distributed with mean0 and std1 - randperm(n) is a random permutation of integers
1n - Irandperm(n) BA(I,) would scramble the rows
of A
9
Seeds
- Random number generators are usually recurrence
equations - r(n)F(r(n-1))
- Must provide an initial value r(0)
- Matlabs random functions are seeded at startup,
but THE SEED IS THE SAME EVERY TIME! - Initialize seed with rand('state', sum(100clock)
) - How would you ensure rand is always random?
10
Its a Small, Small World
- Watts Strogatz (1998) Nature, 393440-442
- Complicated systems can be viewed as graphs
- describe how components are connected
11
Example Six Degrees of Kevin Bacon
- Components (vertices) are actors
- Connections (edges) are movies
- Hypothesis 6 or fewer links separate Kevin Bacon
from all other actors.
12
Example Kevin Bacon Harrison Ford
Top Gun
Witness
A Few Good Men
Star Wars
13
Other Systems
- Power Grid
- Food Webs
- Nervous system of Caenorhabditis elegans
- Goal is to learn about these systems by studying
their graphs - Many of these systems are Small Worlds--only a
few links separate any two points
14
Watts Strogatz
- Can organize graphs on a spectrum from ordered to
random - How do graph properties change across this
spectrum? - Lmean path length ( links between points)
- Ccluster coefficient (lumpiness)
- Used a Monte-Carlo approach--created lots of
graphs along spectrum and computed L and C
15
Watts Strogatz
- Creating the graphs
- n of vertices, knumber of edges/vertex
- Start with a regular ring lattice and change
edges at random with probability p - For every p, compute stats for many graphs
16
Small Worlds in Matlab
- Gcreatelattice(n,k,p)
- creates a lattice--represented as a sparse matrix
- L,Clatticestats(G)
- computes the path length and clustering stats
- L,CSmallWorldsEx(n,k,P,N)
- Creates N graphs for every P(j) and saves the
mean stats in L(j) and C(j) - plotlattice(G)
- Plots a lattice
Recommended
CrystalGraphics Presentations


