
Waco - PowerPoint PPT Presentation
1 / 56
Title: Waco
1
Waco
Killeen
2
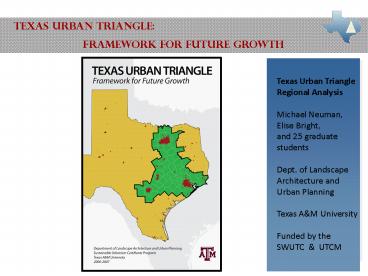
Michael Neuman, Department of Landscape
Architecture and Urban Planning Texas AM
University Elise Bright, Department of Landscape
Architecture and Urban Planning Texas AM
University Douglas Wunneburger, Department of
Landscape Architecture and Urban Planning Texas
AM University David Ellis, Texas Transportation
Institute Jose Gavinha, Department of
Geography Texas AM University Eric
Dumbaugh, Department of Landscape Architecture
and Urban Planning Texas AM University Chris
Ellis, formerly, Department of Landscape
Architecture and Urban Planning
Texas AM University
advisory
3
Plan 662 Plan
675 Ernest Nortey Urban Planning Brent
Bassett Civil Engineering Jacob Browning
Urban Planning Cameron Muhic Urban
Planning Jennifer Opon Urban Planning Chris
Wynveen Rec., Parks Tourism Juton Hortsman
Urban Planning Cristin Burton Urban
Planning Leslie Lutz Urban Planning Joe
Seitzer Architecture Luis Estevez Urban
Planning Munmun Parmar Urban Planning Matthew
Hilgemeier Urban Planning Neethi Rajagopalan
Civil Engineering Michelle Audenaert Urban
Planning Omkar Gupta Urban Planning Shelanski
White Urban Planning Pamela Hile Chen
Architecture Tamara Palma Urban Planning
Sheena Arora Landscape Architecture Tony
Topping Urban Planning Subrity Rajbhandari
Urban Planning Xiaoyu Zhang Urban Planning
Professor Elise Bright Professor Michael
Neuman
4
- Christopher Ellis, et al. (Texas AM University)
- Texas Urban Triangle Working Toward
Sustainable New Communities - 1999 - Texas Department of Transportation Crossroads
of the Americas Trans-Texas Corridor Plan -
2003 - Federal Reserve Bank of Dallas The Texas
Triangle as Megalopolis and The Economics of
the Texas Urban Triangle - 2004 - Regional Plan Association Dancing Through the
Scales From Region to Mega-Region 2004 - Robert Lang and Dawn Dhavale (Virginia Tech
University) Beyond Megalopolis Exploring
Americas New Megalopolitan Geography - 2005 - Jose Gavinha (Texas AM University)
Globalization and the Texan Metropolises
Competition and Complementarity in the T.U.T. -
2007
5
Urban mega-regions identified by the
www.america2050.org
6
Robert Lang Virginia Tech University,
Metropolitan Institute, 2005
Megapolitan Region Anchor Metros Signature Industry
Cascadia Seattle Portland Aerospace
Florida Peninsula Miami Orlando Tourism
Front Range Denver Colorado Springs Telecom
Great Lakes Crescent Chicago Detroit Manufacturing
Gulf Coast Houston Energy
I-35 Corridor Dallas Austin High Tech
Megalopolis New York Washington, D.C Finance
NorCal San Francisco Sacramento High Tech
Piedmont Atlanta Charlotte Consumer Banking
SoCal Los Angeles Las Vegas Entertainment
Sun Corridor Phoenix Tucson Home Building
Megapolitan Regions (2005)
7
Trans Texas Corridor
8
(No Transcript)
9
(No Transcript)
10
(No Transcript)
11
Source Gavinha (2007)
12
Comparing the TX Urban Triangle to other
American metropolises (CSAs) 2007
Total CSA Population Total Personal Income (MSA only) Billions of Dollars Per Capita Personal Income (MSA only)
New York 21,961,994 1,005 53,423
Los Angeles 17,755,322 539 41,875
Chicago 9,745,165 416 43,714
Baltimore -Washington 8,241,912 287 54,211
Boston 7,476,689 241 53,763
San Francisco - San Jose 7,264,887 257 61,337
Philadelphia 6,385,461 264 45,460
TEXAS URBAN TRIANGLE 16,548,737 683 35,542
Census Bureau, Population Division and Bureau of
Economic Analysis
13
Comparing the TX Urban Triangle metropolises, 2007
2007 Total Population Total Personal Income, Millions of Dollars Annual Per Capita Personal Income, Dollars
Dallas Fort Worth 6,144,489 256,943 41,813
Houston 5,629,127 260,213 46,235
San Antonio 1,997,969 68,239 34,279
Austin 1,593,400 59,958 37,517
Bryan / College Station 207,734 5,448 26,790
Texas Urban Triangle 16,548,737 682,903 35,542
Census Bureau, Bureau of Economic Analysis
14
Source United States Bureau of Census (2008)
15
TX Urban Triangle Metropolitan Population
1940 2030
Austin DFW
Houston SA
U.S. Bureau of Census (1950-2000) and Office of
the State Demographer (2030)
16
(No Transcript)
17
Source Hilgemeier (2007)
18
Export Sectors in Texas Triangle Cities as
Indicated by Location Quotients Austin.
Industrial machinery and equipment (3.69)
electronic and other electrical equipment (3.32)
state government (2.27) wholesale trade
(2.08). Dallas/Fort Worth Metroplex. Oil and gas
extraction (4.82) electronic and other
electrical equipment (2.47) transportation by
air (2.49) transportation services (2.12)
communications (1.82). Houston. Oil and gas
extraction (13.81) pipelines, except natural gas
(6.78) petroleum and coal products (4.97)
electric, gas and sanitary services (3.69)water
transportation (3.38) heavy construction (3.03)
transportation services (3.32) chemicals and
allied products (2.43) holding and other
investment offices (2.10). San Antonio. Military
(4.70) electric, gas and sanitary services
(3.13) transportation services (2.85)
insurance carriers (2.35) communications (1.96).
19
- Very good soils are not extensive enough in
Megapolis to be wastefully abandoned to
non-agricultural uses - - Jean Gottman
- 1992-2000 ½ million acres of ranchland lost to
land uses other than agriculture. - 1990s 180,000 acres of Blackland prairies has
been lost to urbanization
Source American Farmland Trust and Texas
Cooperative Extension TAMU System
20
(No Transcript)
21
Source 2007 Texas State Water Plan
22
(No Transcript)
23
(No Transcript)
24
(No Transcript)
25
(No Transcript)
26
(No Transcript)
27
(No Transcript)
28
(No Transcript)
29
(No Transcript)
30
(No Transcript)
31
(No Transcript)
32
Rail Freight Through Texas 1999
33
Truck Freight Flows Through Texas 1998
34
Forecasted VMTs in Selected Counties, 2000 -
2025
Source Forecast prepared by Cambridge Systematics
35
Forecasted VMTs on Inter-City Corridors,
2000 - 2025
Source Forecast prepared by Cambridge Systematics
36
(No Transcript)
37
Source UIC-High Speed. (2008, Feburary 22). UIC.
Retrieved from High Speed http//www.uic.asso.fr/
uic/
38
Source SNCF. (2008). Operating a high-speed rail
network TGV, Eurostar, Thalys. 6th World
Congress on High Speed Rail. Amsterdam UIC.
39
CITY PAIRS IN FRANCE
City A Metro Population (millions) City B Metro Population (millions) Distance between cities (km) Trip time
Paris 11.7 (2006) Lyon 1.6 427 2 hr
Paris 11.7 Tours 0.3 282 1 hr 10 min
Paris 11.7 Calais 0.2 329 1 hr 30 min
Lyon 1.6 Marseille 1.6 251 1 hr 40 min
Paris 11.7 Metz 0.43 300 1 hr 25 min
Paris 11.7 London 13.9 480 2 hr 15 min
London 13.9 (2007) Brussels 1.8 (2008) 250 2 hr
Ridership for the entire France TGV network was
100 million in 2007
Table Source High-Speed Rail International,.
Hon. Rod Diridon Sr. Chair Intercity and High
Speed Rail Committee American Public Transit
Association http//www.authorstream.com/Presentat
ion/paweekly-164498-high-speed-rail-powerpoint-dir
idonhsrail031609-news-reports-ppt GAO report
High Speed Rail Future Development Will Depend
on Addressing Financial and Other Chanllenges and
Establishing a Clear Federal Role
40
(No Transcript)
41
CITY PAIRS IN SPAIN
City A Metro Population (millions) City B Metro Population Distance between cities (km) Travel time
Madrid 5.84 Barcelona 5.10 621 2 hr 38 min
Madrid 5.84 Seville 1.45 472 2 hr 30 min
Ridership for the entire Spain AVE network was 23
million in 2008
Sources 1. GAO report High Speed Rail Future
Development Will Depend on Addressing Financial
and Other Chanllenges and Establishing a Clear
Federal Role 2. Fabregas, L. M. (2008). HighSpeed
Rail In Spain. 6th World Congress on High Speed
Rail. Amsterdam UIC. http//horarios.renfe.es/hi
r/index.jsp?pagehjhir130.jspO51003DMADRIAF2
009MFMMDFDDSFNaNIDi
42
Source http//www.japanrail.com/index.php?pageJR
-Shinkansen-bullet-train
43
CITY PAIRS IN JAPAN
City A Metro Population (millions) City B Metro Population (millions) Distance between cities (km) Riders per year (millions)
Osaka 2.6 Fukuoka 1.4 664 15.1
Ridership for the entire Japan HSR network was
151 million in 2008
Fumio Tanaka. Coexisting and Mutual Prosperity
with the Regions on the Sanyo Shinkansen Line.
UIC 6th World Congress on High Speed Rail.
Amsterdam 2008 http//english.jr-central.co.jp
/company/company/achievement/transportation/index.
html
44
Source In-Soo, C. (2008). Recent achievements in
Korea. 6th World Congress on High Speed Rail.
Amsterdam UIC.
45
CITY PAIRS IN KOREA
City A Metro Population (millions) City B Metro Population Distance between cities (km) Travel time
Seoul 24 Busan 4.2 408.5 2 hr 40 min
Seoul 24 Gwangju 1.7 352.8 2 hr 38 min
Ridership for the entire Korea HSR network was 39
million in 2008
TableSource http//ktx.korail.go.kr/eng/utili/ind
ex.html "??????? ??? 7? ?? ??". The Railroad
News. Korail. 2009-01-23. Retrieved 2009-02-24.
46
(No Transcript)
47
Source Ministry of Railways of the People's
Republic of China
48
Current Amtrak Routes
Route Station FY95 FY00 FY04
Texas Eagle San Antonio - Dallas 80,617 112,444 138,978
Sunset Limited San Antonio- - Houston - Beaumont 51,696 35,055 33,015
TUT Total 132,313 147,499 171,993
Source Amtrak, Department of Government Affairs. Source Amtrak, Department of Government Affairs. Source Amtrak, Department of Government Affairs. Source Amtrak, Department of Government Affairs. Source Amtrak, Department of Government Affairs.
49
- At 320 km/h (200 mph) non-stop
124
50
- Woodlands Population in 2007 is 77,221
Trip Rail Distance (km) stops Time
Houston-Dallas 448 6 150
Houston-Austin 352 5 130
Houston-San Antonio 472 8 200
Houston-College Station 152 3 040
Picture Source http//www.ctchouston.org/intermod
ality/2007/05/23/is-it-time-for-high-speed-rail Ta
ble Source http//www.ctchouston.org/intermodality
/2007/05/23/is-it-time-for-high-speed-rail/
city-data.com
51
- Land suitability analysis
- -- Developed by Ian McHarg (1969) Design With
Nature - -- Used as a regional planning and conservation
tool - -- Identifies areas most suited for different
land uses, thereby
producing more sustainable development
patterns - -- Has become basis for GIS overlapping layers
of info on maps
52
HAZARDS Hurricane Risk Zones Tornado Risk
Zones Location of Hazardous Materials
Facilities
POPULATION Population Density Total
Population Change Population Growth and
Implications
TRANSPORTATION Road Network
ECONOMICS Unemployment Rates
COMMUNICATIONS Fiber Optic Availability
Cell Phone Signal Strength Number of Cell
Phone Carriers Number of Internet Providers
HOUSING Housing Vacancy Rates
LAND USE Urban Area Buffers (2000)
National Land Cover Database (1992)
EDUCATION Academic Accountability Rating
Property Wealth Expenditures per Student
Student-to-Teacher Ratio
ENVIRONMENT Visual Quality Air Quality
Surface Water
PUBLIC SERVICES Police Protection Crime
Rates Infant Mortality Cancer Death Rates
GEOLOGY, SOILS TOPOGRAPHY Prime Farmlands
Aquifer Recharge Zones Slope Soil
Salinity
ENERGY Location of Coal Deposits Location
of Power Generators Air Emissions (due to
electric generation)
WATER Water Supply
53
- Analyze many major environmental elements
- Categorize each element
- Assign weights to each category for each
anticipated land use type - Divide the study area into pixels
- Add the weights for each future land use
for each pixel - Select the pixels that get the highest scores for
each land use type
54
(No Transcript)
55
- County and Regional Planning
- Urban Growth Management
- High Speed Rail and Local Public Transit
- Regional and Green Infrastructure Networks
- Infrastructure Financing
- Water Policy
- Farmland Preservation
56
TEXAS URBAN TRIANGLE FRAMEWORK FOR FUTURE GROWTH
http//texasurbantriangle.tamu.edu http//susta
inableurbanism.tamu.edu Click on projects
Recommended
CrystalGraphics Presentations


