Sin t - PowerPoint PPT Presentation
Title:
Sin t
Description:
... captured by a variety of sensors and automatically stored in a 1.5.000 cartography ... GeoMedia Data Model based on'Real Cartography' and Dynamic Segmentation ... – PowerPoint PPT presentation
Number of Views:29
Avg rating:3.0/5.0
Title: Sin t
1
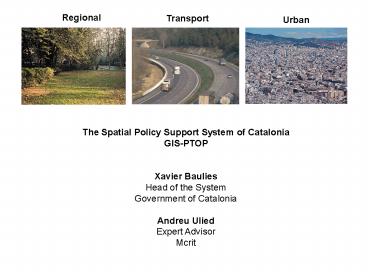
Regional
Transport
Urban
The Spatial Policy Support System of
Catalonia GIS-PTOP
Xavier Baulies Head of the System Government of
Catalonia Andreu Ulied Expert Advisor Mcrit
2
The Spatial Policy Support System of Catalonia
GIS-PTOP
Xavier Baulies Head of the System Government of
Catalonia
Current situation User-Needs System-Requirement
s System-Architecture Implementation plan Data
Model Questions
3
Current situation
- Different systems managed by different services
with heterogenous development levels. - Spontaneous co-ordination or gradual reforms
are unfeasible in practice because of the
rigidities and inerties created in all the
different systems, specially due to - the lack of explicit metadata procedures and
- the use of heterogeneous Data Models.
- There is a need for a radical change to create
a new system which can not be just the addition
of existing pieces. - The Spatial Policy Support System of Catalonia
will be defined with a global top-down approach,
and implemented with a bottom-up inclusive
strategy.
4
User-needs
- Cross-sectorial to assess urban, transport and
regional policies - Multi-scale integration
- Useful for mangement (e.g. Road maintenance...)
- Useful for planning (e.g. Road traffic
forecast...) - Comprehensive service provision
- information
- forecast
- evaluation
- decision-support
- Cutomised for different user-profiles
- Useful for policy-makers (friendly access to key
modules)
5
System requirements Functional architecture
Strategic indicators
Performance indicators
Predictions (forecasts)
Analytic Graphs
Policy Actions
Actual data (monitoring)
Real Cartography (15.000)
Policy actions are both Management policies and
Strategic policies.
6
Management Policies
Actual data
Cartography (15.000)
Real data captured by a variety of sensors and
automatically stored in a 1.5.000 cartography
Monitoring Performance Indicators
7
Performance indicators Minimum threhold levels
have to be permanently assured in a
cost-effective manner
Accidents (Black points)
Level of Service (Bottlenecks)
Infrastructure maintenance (Red points)
8
Predictions (forecasts)
Analytic Graphs
Strategic Policies
Actual
Forecasted
Forecasting the impacts of policy actions
9
Strategic indicators CBA, MCA and SEA methods to
evaluate and rank strategic long-term plans
Protection (SEA)
Which Policy?
Switzerland
NATURE
Netherlands
LIBERAL
EQUILIBRIUM
Growth (CBA)
Cohesion (MCA)
Baden-Würtemberg
10
System-architecture
- Centralised system administration and strict
metadata protocols - Single Data Model for the whole system (based on
GTF extended to cover Urban and Territorial
aspects explicitely) - Standard software platform Database management
(ORACLE) and GIS (Geomedia) as a reference
platform for information management. - Specialised modules for advanced analytic tasks,
forecast and decision-support using the most
suitable software, and sharing the Data Model and
exchange formats to guarantee full compatibility - Highly customised user-interfaces for different
information management tasks built upon standard
tools whenever is feasible (Desktop mapping,
text editors, spreadsheets and multimedia
software for communication and visualisation
purposes).
11
Systems Ontology
As deeper the incompatibility, as difficult to
solve becomes
Knowledge language
Data Exchange Format
Database structure
Software
Data Model
The definition of a Data Model is the necessary
first step to build up open and inclusive
multi-software system
12
Development and implementation plan
GIS-PTOP
- Development of the Road Policy Support System
- Definition of performance indicators to be
monitored (2001) - Definition of the Road Data Model (2001)
- Development of the modules (Maintenance and
Signalling, Traffic counts, Safety...) (2002) - Implementation of the system (2002)
- Definition of the Data Model for the whole system
(2001-2002) - Development of a prototype for the whole system
(Electronic Atlas) to facilitate future users
active participation in the process (2002) - Future development of the whole system (2003 and
beyond)
13
Data Model Questions under study
GIS-PTOP
- How to integrate multi-scale levels?
- Real maps
- Abstract graphs
- How to explicitely include as time-dependent
events such as accidents, congestion... as well
as management and strategic policies? - How to integrate the logics of multi-sectorial
levels? - Transport System
- Urban System
- Regional System
- What balance between centralised communication
procedures and highly de-centralised and
customised modules can be achieved?
14
How to integrate on-line real data within an
information system having the complex
topologia needed to support trafficmodelling?
15
GeoMedia Data Model based onReal Cartography
and Dynamic Segmentation (GDF-UNETRANS
compatibility?)
16
GTF-NIS Data Model based on abstract graphs and
complex multi-modal transport topologies (Compati
bility with GeoMedia Data Model?)
17
Working hypothesis to be validated...
- A single Data Model for both real maps and
abstract graphs (which should be GTF since it is
the more abstract and generalised). - Two independent databases concerning entities and
relationships - Real cartography at 15.000 supported by Dynamic
Segmentation (Geomedia Transport Data Model,
UNETRANS, GDF...) - Abstract graph supported by the Complex Topology
needed to be linked to traffic forecast models
(GTF...) - Specialised routines to capture data attached to
anyone of these two levels, process it, and
exchange with the other level based on explicit
rules (Expert System).
18
Not everything can be covered Spontaneous
pedestrian path in Brasilia


