GIS and Remote Sensing Technology - PowerPoint PPT Presentation
1 / 20
Title:
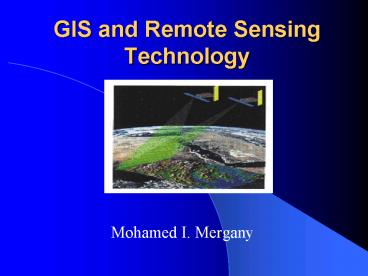
GIS and Remote Sensing Technology
Description:
... models to identify areas the would be inundated at different flood levels ... the 100 and 500 year flood inundation limits, and 3D model of building in ... – PowerPoint PPT presentation
Number of Views:64
Avg rating:3.0/5.0
Title: GIS and Remote Sensing Technology
1
GIS and Remote Sensing Technology
- Mohamed I. Mergany
2
Contents
- Introduction
- Remote Sensing Benefits
- GIS and Remote Sensing Integration
- Advantages of Integration
- Important Developing Trends
- Examples of Integration Case Studies
3
Introduction
- R.S growing is helping us observe, study and
learn about our world - R.S is a potentially powerful complement to GIS
- R.S integrate into the GIS processing stream
- multilayer integration of raster and vector data
within the GIS environment is important as we
move forward
4
Remote Sensing Benefits
- Allows to collect information over regions too
costly, too dangerous or too remote - Takes many forms aerial photography, digital
satellite imagery and radar - Produce maps of the earth's land and seafloor
topography, natural resources and urban
infrastructure - Serves as a valuable historical record
5
Continuous zoom from global-scale imagery to
high-resolution aerial imagery overlain with
extruded vector data
Source Data courtesy of the City and County of
Honolulu
6
- Gulf Stream, E-N USA
- This image clearly shows the pattern of the
Gulf Stream, the warm water current that flows
east toward northern Europe (shown here as
yellow, orange and red with red being warmest) - captured by the NASA MODIS sensor
- Source University of Wisconsin-Madison Space
Science and Engineering Center
7
GIS and R.S Integration
- R.S is included within the field of Geomatics"
which are the group of technologies, disciplines
that collect, store, analyze geospatial
information - Improved GIS tools and Software packages
- Applications implemented using GIS depend on
- datasets derived from remotely sensed imagery
- use imagery as a background in graphic displays
8
- vector data displayed over an Orthoimage
background in a GIS
Source ESRI and DigitalGlobe
9
real-time Videography integrated with a GIS
- GIS-based Videography application provided
simultaneous real-time display of the video
imagery from a helicopter-based camera and the
helicopter position overlaid on a detailed area
map
Source Image courtesy of BlueGlen
Technology,Ltd.
10
- Flood risk mapping
- Digital elevation models generated from lidar
data of the Winnipeg Floodway and Red River were
used in hydrologic models to identify areas the
would be inundated at different flood levels - Key 1m flood level-light green, 2m-dark green,
3m-brown, 4m-purple, 5m-beig. The accuracyof the
dataset is 15-30cm
Source Mosaic Mapping System,Inc./TerraPoint
USA,Inc.
11
Flood simulations
- Lidar data was used to generate a bald earth
surface, the 100 and 500 year flood inundation
limits, and 3D model of building in an urban area
for this flood simulation
Source Image courtesy of Earthdata
Holdings,Inc
12
Advantages
- Facilitate access to a variety of data and
information - Facilitate the creation, updating and
modification of maps - Improve our ability to model important science
research questions and operational resource
management tasks - Enhance graphic display of complex phenomena, and
thus, our understanding, and - Provide tools for enhancing decision making
13
Important Developing Trends
- Improvements in the quality and quantity of
remotely sensed data available - Improvements in computer hardware and software
- Increasing population and competition for natural
resources - Decreasing resource availability and
environmental quality
14
Important Developing Trends
- Recognition of the global nature of problems
- An increase in the number of public and private
organizations working on local, national,
regional and international problems - The creation of larger and larger data bases to
provide information in various scale
15
GIS and R.S technology have been applied to a
range of applications such as
Examples of Integration
- Agriculture
- Forestry
- Geology
- Archaeology
- Military
- Geospatial intelligence analysis
- Urban infrastructure
- Business geographic
- Meteorology, Oceanography and Climatology
16
Geology
- Satellite images gave geologist a unique
opportunity to observe the complex interaction of
large-scale geological structures that make up
earth's landscape
Source Courtesy of Image Interpretation
Technologies. Calgary, Alberta.
17
Seismic surveys record
- The time and strength of sound waves
reflected from different rock strata beneath the
earth's surface to a set of receivers placed in
the ground. The illustration shows a typical
presentation of this data as a profile
Source Courtesy of Image Interpretation
Technologies, Calgary, Alberta.
18
- Today the availability of integration of
satellite imagery with traditional exploration
datasets and how GIS can be used to integrate
multiple datasets to refine interpretation
Source Courtesy of Image Interpretation
Technologies, Calgary, Alberta.
19
- HRAM and Radarsat-1 data integration over the
Dianongo Trough, Gabon - The imagery has been overlain with a color
transparency to indicate the main geological
outcrops in the area
Source Courtesy of Image Interpretation
Technologies, Calgary, Alberta.
20
Thanks for your attention
- Question ?


