
Correlation - PowerPoint PPT Presentation
Title:
Correlation
Description:
Relationship Between Two Numerical Variables. Relationship Between Two Numerical Variables ... Closely related to regression - the topic for next Tuesday's lecture ... – PowerPoint PPT presentation
Number of Views:18
Avg rating:3.0/5.0
Title: Correlation
1
Correlation
2
Two variables Which test?
X
Contingency analysis
Logistic regression
Y
Correlation Regression
t-test
3
Two variables Which test?
X
Contingency analysis
Logistic regression
Y
Correlation Regression
t-test
4
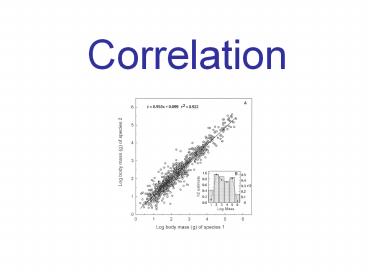
Relationship Between Two Numerical Variables
5
Relationship Between Two Numerical Variables
6
Correlation
- What is the tendency of two numerical variables
to co-vary (change together)?
7
Correlation
- What is the tendency of two numerical variables
to co-vary (change together)? - Correlation coefficient r measures the strength
and direction of the linear association between
two numerical variables
8
Correlation
- What is the tendency of two numerical variables
to co-vary (change together)? - Correlation coefficient r measures the strength
and direction of the linear association between
two numerical variables - Population parameter r (rho)
- Sample estimate r
9
(No Transcript)
10
Sum of squares X and Y
11
Sum of products
Sum of squares X and Y
12
Shortcuts
13
r
r
r
r
14
Correlation assumes...
- Random sample
- X is normally distributed with equal variance for
all values of Y - Y is normally distributed with equal variance for
all values of X
15
Correlation assumes...
- Random sample
- X is normally distributed with equal variance for
all values of Y - Y is normally distributed with equal variance for
all values of X
Bivariate normal distribution
16
Correlation coefficient facts
- -1 lt r lt 1 -1 lt r lt 1
17
Correlation coefficient facts
- -1 lt r lt 1 -1 lt r lt 1
- Positive r variables increase together
- Negative r when one variable increases, the
other decreases, and vice-versa
18
Correlation coefficient facts
- -1 lt r lt 1 -1 lt r lt 1
- Positive r variables increase together
- Negative r when one variable increases, the
other decreases, and vice-versa
uncorrelated
positive
negative
r0
r 1
r -1
19
Correlation coefficient facts
- Coefficient of determination r2
- Describes the proportion of variation in one
variable that can be predicted from the other
20
Standard error of r
21
Confidence Limits for r
22
Example
- Are the effects of new mutations on mating
success and productivity correlated? - Data from Drosophila melanogaster
- n 31 individuals
23
X is productivity, Y is the mating success
- Sum of products 2.796
- Sum of squares for X 16.245
- Sum of squares for Y 1.6289
24
X is productivity, Y is the mating success
25
(No Transcript)
26
(No Transcript)
27
Confidence Limits for r
28
Confidence Limits for r
29
Confidence Limits for r
30
Confidence Limits for r
31
Confidence Limits for r
32
Confidence Limits for r
33
Example Why Sleep?
34
Example Why Sleep?
- 10 experimental subjects
- Measured increase in slow-wave activity during
sleep - Measured improvement in task after sleep -
hand-eye coordination activity
35
Example Why Sleep?
36
Why sleep?
- Sum of products 1127.4
- Sum of squares X 2052.4
- Sum of squares Y 830.9
- Calculate a 95 C.I. for ?
37
Hypothesis Testing for Correlations
- Can test hypotheses relating to correlations
among variables - Closely related to regression - the topic for
next Tuesdays lecture
38
Hypothesis Testing for Correlations
- H0 r 0
- HA r ? 0
39
If r 0,...
r is normally distributed with mean 0
with df n -2
40
Example
- Are the effects of new mutations on mating
success and productivity correlated? - Data from Drosophila melanogaster
41
Hypotheses
- H0 Mating success and productivity are not
related (r 0) - HA Mating success and productivity are
correlated (r ? 0)
42
X is productivity, Y is the mating success
- Sum of products 2.796
- Sum of squares for X 16.245
- Sum of squares for Y 1.6289
43
(No Transcript)
44
(No Transcript)
45
df n-231-229
46
df n-231-229
47
Why sleep?
- Sum of products 1127.4
- Sum of squares X 2052.4
- Sum of squares Y 830.9
- Test for a correlation different from zero in
these data.
48
Checking Assumptions for Correlation
- Bivariate normal distribution
- Relationship is linear (straight line)
- Cloud of points in scatter plot is circular or
elliptical - Frequency distributions of X and Y are normal
49
Linear Relationship?
50
(No Transcript)
51
Maximum correlation possible
52
Maximum correlation possible
Correlation of zero
53
Maximum correlation possible
Correlation of zero
54
Cloud of points elliptical?
55
X and Y normal?
- Use usual techniques for both X and Y separately
- Be wary of outliers
56
Quick Reference Guide - Correlation Coefficient
- What is it for? Measuring the strength of a
linear association between two numerical
variables - What does it assume? Bivariate normality and
random sampling - Parameter ?
- Estimate r
- Formulae
57
Quick Reference Guide - t-test for zero linear
correlation
- What is it for? To test the null hypothesis that
the population parameter, ?, is zero - What does it assume? Bivariate normality and
random sampling - Test statistic t
- Null distribution t with n-2 degrees of freedom
- Formulae
58
T-test for correlation
Null hypothesis ?0
Sample
Test statistic
Null distribution t with n-2 d.f.
compare
How unusual is this test statistic?
P gt 0.05
P lt 0.05
Reject Ho
Fail to reject Ho
Recommended
CrystalGraphics Presentations


