
Polluted profile from GEOS-Chem model used as initial guess - PowerPoint PPT Presentation
Title:
Polluted profile from GEOS-Chem model used as initial guess
Description:
Polluted profile from GEOS-Chem model used as initial guess ... for reduced visibility in national parks and scenic areas (Malm et al., 2000) ... – PowerPoint PPT presentation
Number of Views:14
Avg rating:3.0/5.0
Title: Polluted profile from GEOS-Chem model used as initial guess
1
Satellite Observations of Tropospheric Ammonia -
Motivation and First Results
Mark W.Shephard, Karen E. Cady-Pereira, Vivienne H.Payne AER, Inc. Ming Luo, Curtis P. Rinsland, Reinhard Beer, Greg Osterman, Kevin Bowman NASA-JPL Daven Henze Columbia University Robert W.Pinder US EPA-ORD Gary Lear US EPA-CAMD Shephard A. Clough Clough Associates
- 1. Motivation
- Nitrogen in ammonia is deposited to Earths
surface - Excess nitrogen leads to
- Nutrient imbalances
- Change in ecosystem composition
- Algal blooms
- Hypoxia
- Ammonium sulfate and ammonium nitrate form 10-20
of fine particulate matter (PM2.5) in atmosphere
over the US - Exceeds recommended threshold (WHO, 2003)
- Excessive exposure to aerosol concentration is
associated with - Increased chances of cardiovascular disease
- Inhibited lung development
- Premature death
- References (Burnett et al., 2000 Dominici et
al., 2006 Gauderman et al., 2004 Pope , 2000
Pope et al., 2002) - Fine particulates are also responsible for
reduced visibility in national parks and scenic
areas (Malm et al., 2000) - Point sources and short lifetime (less than 10
days) lead to high temporal and spatial
variability - In-situ measurement of ammonia are difficult
and sparse - mostly confined to near surface
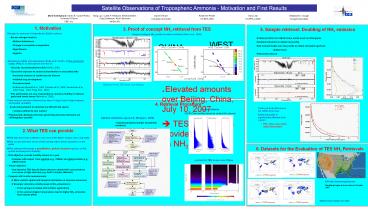
3. Proof of concept NH3 retrieval from TES Simple
scaling of NH3 profile to reduce residuals (Beer
et al., 2008)
5. Sample retrieval Doubling of NH3 emission
- Polluted profile from GEOS-Chem model used as
initial guess - Doubled emissions to obtain new profile
- Ran forward model over new profile to obtain
simulated spectrum - Added noise
- Performed retrieval
CHINA
WEST COAST
Spectrum from TES pass over Beijing
? Elevated amounts over Beijing, China, July 10,
2007 ? TES spectra can provide information on NH3
variability
4. Retrieval Procedure
- Retrieved-truth differences are within error bars
- Retrieved profile is significantly different from
a priori - TES retrieval provided added information
a priori estimate GEOS-Chem profiles binned by
surface NH3 amount
- Optimal estimation approach. (Rodgers, 2000)
- ill-posed problem (number of potential
solutions) - nonlinear least square with constraints
2. What TES can provide
- ?TES data have been collected over most of the
Earth surface since July 2004 - ?TES can provide time series of NH3 mixing ratios
almost anywhere on the globe - ?This dataset will provide a quantitative,
global, long-term picture of NH3 spatial and
temporal variability - First objective provide monthly means for a year
- Compare with output from regional (e.g., CMAQ)
and global models (e.g., GEOS-Chem) - Future objective
- Use intensive TES Special Observations to obtain
NH3 concentrations over areas of high emission
(e.g. North Carolina, Midwest) - Compare with in-situ measurements
- ? More realistic spatial and temporal
distribution of ammonia emissions - ? Example determine whether peak of NH3
emissions is - In the spring (correlated with fertilizer
application) - In the summer (higher temperatures lead to higher
NH3 emissions from manure piles)
6. Datasets for the Evaluation of TES NH3
Retrievals
a priori for TES scans over China
EPA NH3 Monitoring Network Sampling began at most
sites in October 2007
GEOS-Chem Output for 2005
Recommended
CrystalGraphics Presentations


