
1.3. Problem-Solving-using-Analytics - PowerPoint PPT Presentation
Title:
1.3. Problem-Solving-using-Analytics
Description:
Business Data Analytics – PowerPoint PPT presentation
Number of Views:0
Title: 1.3. Problem-Solving-using-Analytics
1
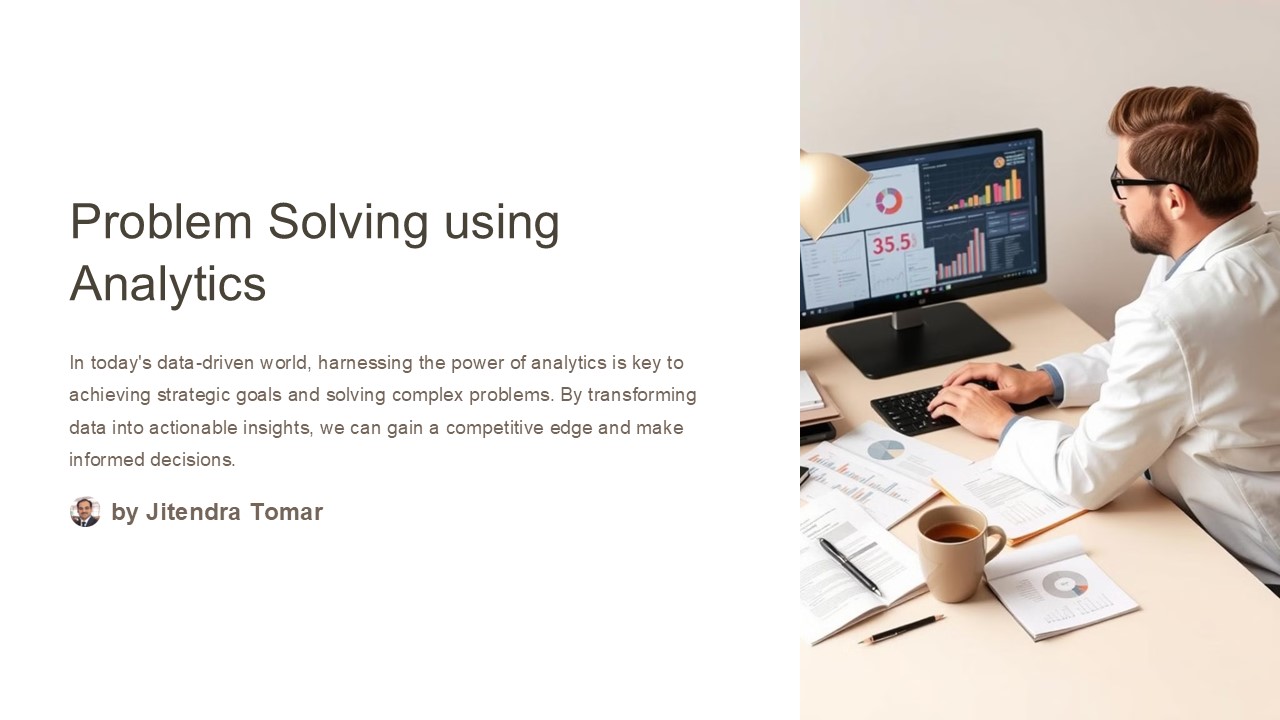
Problem Solving using Analytics
In today's data-driven world, harnessing the
power of analytics is key to achieving strategic
goals and solving complex problems. By
transforming data into actionable insights, we
can gain a competitive edge and make informed
decisions.
by Jitendra Tomar
2
The Importance of Data-Driven Decision Making
Increased Accuracy
Enhanced Efficiency
Competitive Advantage
Data-driven decisions rely on evidence, reducing
the risk of bias and improving decision-making
accuracy.
Analytics helps identify areas for improvement,
leading to better resource allocation and
optimized processes.
By leveraging data to understand market trends
and customer behavior, businesses gain a
competitive advantage.
3
Defining the Problem Statement
Identify the Problem
1
2
Define the Scope
3
Formulate a Clear Objective
A well-defined problem statement sets the
foundation for effective problem-solving. It
clarifies the issue, sets the scope, and outlines
the desired outcome.
4
Gathering and Organizing Relevant Data
Data Sources
Data Cleaning
Identify and access relevant data from internal
and external sources.
Clean and validate data to ensure accuracy and
consistency.
Data Organization
Organize data into a structured format that
supports analysis.
5
Exploratory Data Analysis Techniques
Descriptive Statistics
Data Visualization
Correlation Analysis
Summarize data characteristics using measures
like mean, median, and standard deviation.
Create charts and graphs to uncover patterns and
trends in data.
Examine relationships between variables to
identify potential causal connections.
6
Identifying Patterns and Insights
1
Data Exploration
2
Pattern Recognition
3
Insight Generation
By analyzing data patterns and trends, we can
uncover hidden insights that may not be readily
apparent.
7
Developing Hypotheses and Testing Assumptions
Hypothesis Formulation
Based on initial observations and insights,
formulate testable hypotheses.
Data Analysis
Analyze data to test the validity of hypotheses.
Assumption Validation
Evaluate the validity of assumptions and refine
hypotheses based on data findings.
8
Applying Analytical Models and Algorithms
Regression Analysis
Classification Models
Predict outcomes based on relationships between
variables.
Categorize data into different groups based on
their characteristics.
Clustering Techniques
Identify natural groupings within data based on
similarities.
9
Interpreting Results and Drawing Conclusions
1
2
3
Data Interpretation
Conclusion Drawing
Recommendation Generation
Data interpretation involves analyzing raw data
to extract meaningful insights, patterns, and
trends. This process helps in understanding the
underlying relationships within the data, guiding
informed decision-making.
10
Interpreting Results and Drawing Conclusions
1
2
3
Data Interpretation
Conclusion Drawing
Recommendation Generation
Conclusion drawing refers to the process of
summarizing and making sense of the findings
derived from the data analysis. It involves
synthesizing the information to determine the
implications and form a coherent final judgment
based on evidence.
11
Interpreting Results and Drawing Conclusions
1
2
3
Data Interpretation
Conclusion Drawing
Recommendation Generation
Recommendation generation is the process of
suggesting actionable steps based on the
conclusions drawn from data analysis. These
recommendations are designed to address
identified issues or opportunities and provide
guidance for improving performance or achieving
goals.
12
Interpreting Results and Drawing Conclusions
1
2
3
Data Interpretation
Conclusion Drawing
Recommendation Generation
Drawing clear and actionable conclusions from
data analysis is crucial for guiding future
decisions and actions.
13
Communicating Findings and Recommendations
Present findings and recommendations in a clear,
concise, and easy-to-understand format.
14
Communicating Findings and Recommendations
Back up findings with data, ensuring that
recommendations are rooted in solid evidence.
15
Communicating Findings and Recommendations
Provide practical, achievable recommendations
that can be implemented effectively.
16
Communicating Findings and Recommendations
Tailor the communication style and level of
detail to the target audience's needs and
understanding.
17
Communicating Findings and Recommendations
Use charts, graphs, and other visual aids to
enhance understanding and highlight key points.
18
Communicating Findings and Recommendations
Relate findings and recommendations to the
broader goals or challenges being addressed.
19
Communicating Findings and Recommendations
Emphasize the potential impact of recommendations
on outcomes or performance.
20
Thats all folks
- Learning is an ART
Recommended
CrystalGraphics Presentations


