
Designing Effective Process Maps in PowerPoint: Tips and Techniques - PowerPoint PPT Presentation
Title:
Designing Effective Process Maps in PowerPoint: Tips and Techniques
Description:
Creating a map legend in PowerPoint is easy and helps make your maps clearer. Start by adding a shape or text box for the legend and label it for easy understanding. To link a map, insert an image or use SmartArt, then select the map and use the hyperlink feature to connect it to s or external links. For a process map, use shapes and connectors to show the steps clearly. You can format your map by adjusting colors, fonts, and styles to match your presentation's look. If you want to add a stock chart, go to the "Insert" tab, select "Chart," and choose "Stock." Enter your data, and PowerPoint will create a professional stock chart for your presentation. This process helps enhance the visual appeal and effectiveness of your s. – PowerPoint PPT presentation
Number of Views:0
Date added: 23 February 2025
Slides: 3
Provided by:
visualsculptors
Category:
How To, Education & Training
Tags:
Title: Designing Effective Process Maps in PowerPoint: Tips and Techniques
1
Data Visualization Charts, Graphs and
Infographic designs - MS Graph Top Inquiries
Answered
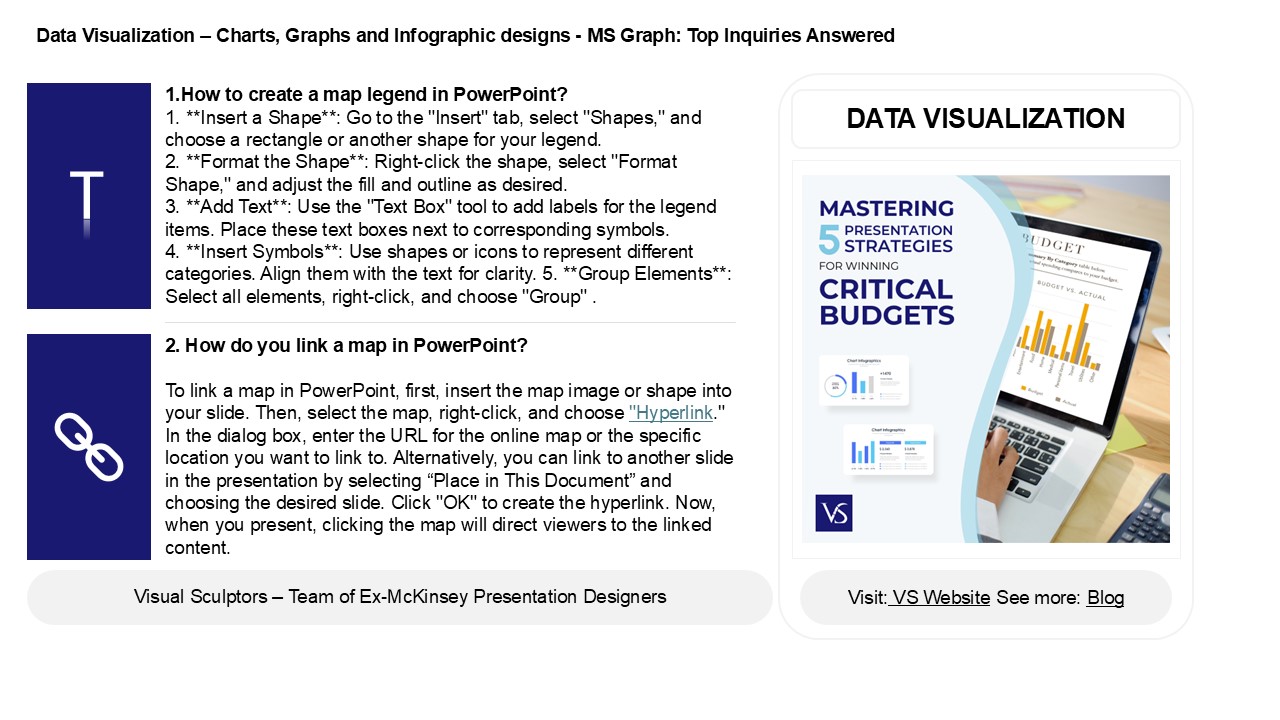
1.How to create a map legend in PowerPoint?
1. Insert a Shape Go to the "Insert" tab,
select "Shapes," and choose a rectangle or
another shape for your legend. 2. Format the
Shape Right-click the shape, select "Format
Shape," and adjust the fill and outline as
desired. 3. Add Text Use the "Text Box" tool
to add labels for the legend items. Place these
text boxes next to corresponding symbols. 4.
Insert Symbols Use shapes or icons to
represent different categories. Align them with
the text for clarity. 5. Group Elements
Select all elements, right-click, and choose
"Group" .
DATA VISUALIZATION
T
2. How do you link a map in PowerPoint? To link
a map in PowerPoint, first, insert the map image
or shape into your slide. Then, select the map,
right-click, and choose "Hyperlink." In the
dialog box, enter the URL for the online map or
the specific location you want to link to.
Alternatively, you can link to another slide in
the presentation by selecting Place in This
Document and choosing the desired slide. Click
"OK" to create the hyperlink. Now, when you
present, clicking the map will direct viewers to
the linked content.
2
Data Visualization Charts, Graphs and
Infographic designs - MS Graph Top Inquiries
Answered
3. How do I create a process map in PowerPoint?
To create a process map in PowerPoint, start by
opening a new slide. Use the "Insert" tab to add
shapes like rectangles (for tasks) and diamonds
(for decisions). Connect these shapes using
arrows to indicate the flow of the process. You
can find additional shapes in the "Shapes" menu.
Customize colors and styles for clarity. Add text
to each shape to describe the steps involved.
Utilize SmartArt under the "Insert" tab for
pre-designed options. Finally, review the layout
for readability and coherence before saving or
presenting.
4. How do I format a Map in PowerPoint? To
format a map in PowerPoint, first, insert the map
by going to the "Insert" tab and selecting "Maps"
or "Pictures." Once the map is in your slide,
select it to access the "Picture Format" or
"Format" tab. Here, you can adjust styles, apply
effects, and change colors. Use the "Shape Fill"
and "Shape Outline" options for customization.
Additionally, consider adding text boxes for
labels or annotations. To enhance visibility, you
can also use the "Format Background" option to
change the slide's background color.
5. How do I put a stock chart in PowerPoint? To
insert a stock chart in PowerPoint, first, open
your presentation and navigate to the slide where
you want the chart. Click on the "Insert" tab,
then select "Chart." In the Chart dialog, choose
"Stock" from the list of chart types. Select the
specific stock chart style you prefer (like
High-Low-Close or Open-High-Low-Close) and click
"OK." This will open an Excel sheet where you can
input your stock data. After entering the data,
close Excel, and your stock chart will be
displayed on the slide. Adjust the size and
position as needed.
Recommended
CrystalGraphics Presentations


