
Measurement and Evaluation - PowerPoint PPT Presentation
Title:
Measurement and Evaluation
Description:
'For better or worse, benchmarks shape a field' Good products created when have: Good benchmarks. Good ways to summarize performance ... – PowerPoint PPT presentation
Number of Views:47
Avg rating:3.0/5.0
Title: Measurement and Evaluation
1
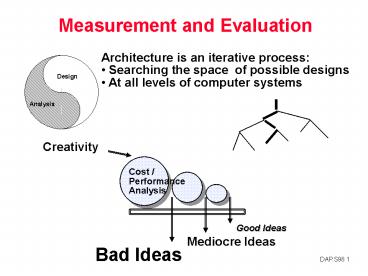
Measurement and Evaluation
- Architecture is an iterative process
- Searching the space of possible designs
- At all levels of computer systems
Creativity
Cost / Performance Analysis
Good Ideas
Mediocre Ideas
Bad Ideas
2
Computer Engineering Methodology
Technology Trends
3
Computer Engineering Methodology
Evaluate Existing Systems for Bottlenecks
Benchmarks
Technology Trends
4
Computer Engineering Methodology
Evaluate Existing Systems for Bottlenecks
Benchmarks
Technology Trends
Simulate New Designs and Organizations
Workloads
5
Computer Engineering Methodology
Evaluate Existing Systems for Bottlenecks
Implementation Complexity
Benchmarks
Technology Trends
Implement Next Generation System
Simulate New Designs and Organizations
Workloads
6
This class tools for doing this
- Benchmarks, Traces, Mixes
- Hardware Cost, delay, area, power estimation
- Simulation (many levels)
- ISA, RT, Gate, Circuit
- Queuing Theory
- Rules of Thumb
- Fundamental Laws/Principles
7
The Bottom Line Performance (and Cost)
Plane
Boeing 747
BAD/Sud Concodre
- Latency Time to run the task
- Execution time, response time, latency
- Throughput Tasks per day, hour, week, sec, ns
- Throughput, bandwidth
8
Metrics of Performance
Application
Answers per month Operations per second
Programming Language
Compiler
(millions) of Instructions per second
MIPS (millions) of (FP) operations per second
MFLOP/s
ISA
Datapath
Megabytes per second
Control
Function Units
Cycles per second (clock rate)
Transistors
Wires
Pins
9
Performance Evaluation
- For better or worse, benchmarks shape a field
- Good products created when have
- Good benchmarks
- Good ways to summarize performance
- Given sales is a function in part of performance
relative to competition, investment in improving
product as reported by performance summary - If benchmarks/summary inadequate, then choose
between improving product for real programs vs.
improving product to get more salesSales almost
always wins! - Execution time is the measure of computer
performance!
10
Benchmarking Problems
- Bad benchmarks MIPS, Drystone, MFLOPS, Toys
(quicksort, fibonacii, ) - What you care about is how long to run your
problem - Better benchmark looks more like your problem
- Benchmarking games (commercial and research)
- Different configurations to run same workload on
2 systems - Comiler wired to optimize workload
- Test specification biased towards one machine
- Arbitrary workload
- Small benchmark
- Benchmark manually translated to optimize
performance
11
Benchmarking Problems
- Common mistakes
- Only average behavior in test workload
- Average load on machine is about 0!
- You care about 98 load
- Skewing of requests ignored
- Caching effects ignored
- Inaccurate sampling
- e.g. when timer goes off take sample
- timer interrupts lost when machine busy
- Ignoring monitoring overhead
- Not validating measurements
- Not ensuring same initial conditions
- Not meauring transient cold-start performance
- Collecting too much data but doing too little
analysis
12
How to Summarize Performance
- Faster than
- X is n times faster than Y means
- performance(X)/performance(Y)
throughput(X)/throughput(Y) ExecutionTime(Y)/Exe
cutionTime(X) - Notice performance is inverse of execution time
- Never say slower than
13
How to Summarize Several Numbers
- Arithmetic mean (weighted arithmetic mean) tracks
execution time (Ti)/n or (WiTi) - Harmonic mean (weighted harmonic mean) of rates
(e.g., MFLOPS) tracks execution time n/(1/Ri)
or n/(Wi/Ri) - Normalized execution time is handy for scaling
performance (e.g., X times faster than
SPARCstation 10) - But do not take the arithmetic mean of normalized
execution time, use the geometrici)1/n)
14
SPEC First Round
- One program 99 of time in single line of code
- New front-end compiler could improve dramatically
15
Impact of Means on SPECmark89 for IBM 550
- Ratio to VAX Time Weighted
Time - Program Before After Before After Before After
- gcc 30 29 49 51 8.91 9.22
- espresso 35 34 65 67 7.64 7.86
- spice 47 47 510 510 5.69 5.69
- doduc 46 49 41 38 5.81 5.45
- nasa7 78 144 258 140 3.43 1.86
- li 34 34 183 183 7.86 7.86
- eqntott 40 40 28 28 6.68 6.68
- matrix300 78 730 58 6 3.43 0.37
- fpppp 90 87 34 35 2.97 3.07
- tomcatv 33 138 20 19 2.01 1.94
- Mean 54 72 124 108 54.42 49.99
- Geometric Arithmetic
Weighted Arith. - Ratio 1.33 Ratio 1.16 Ratio 1.09
16
Amdahl's Law
- Speedup due to enhancement E
- ExTime w/o E
Performance w/ E - Speedup(E) -------------
------------------- - ExTime w/ E Performance w/o
E - Suppose that enhancement E accelerates a fraction
F of the task by a factor S, and the remainder of
the task is unaffected
17
Amdahls Law
ExTimenew ExTimeold x (1 - Fractionenhanced)
Fractionenhanced
Speedupenhanced
1
ExTimeold ExTimenew
Speedupoverall
(1 - Fractionenhanced) Fractionenhanced
Speedupenhanced
18
Amdahls Law
- Floating point instructions improved to run 2X
but only 10 of actual instructions are FP
ExTimenew
Speedupoverall
19
Amdahls Law
- Floating point instructions improved to run 2X
but only 10 of actual instructions are FP
ExTimenew ExTimeold x (0.9 .1/2) 0.95 x
ExTimeold
1
Speedupoverall
1.053
0.95
20
Aspects of CPU Performance
- Inst Count CPI Clock Rate
- Program X
- Compiler X (X)
- Inst. Set. X X
- Organization X X
- Technology X
21
Integrated Circuits Costs
- IC cost Die cost Testing cost
Packaging cost - Final
test yield - Die cost Wafer cost
- Dies per Wafer Die
yield - Dies per wafer ( Wafer_diam / 2)2
Wafer_diam Test dies - Die
Area 2 Die Area - Die Yield Wafer yield 1
???
Defects_per_unit_area Die_Area
?
Die Cost goes roughly with die area4
22
Real World Examples
- Chip Metal Line Wafer Defect Area Dies/ Yield Die
Cost layers width cost
/cm2 mm2 wafer - 386DX 2 0.90 900 1.0 43 360 71 4
- 486DX2 3 0.80 1200 1.0 81 181 54 12
- PowerPC 601 4 0.80 1700 1.3 121 115 28 53
- HP PA 7100 3 0.80 1300 1.0 196 66 27 73
- DEC Alpha 3 0.70 1500 1.2 234 53 19 149
- SuperSPARC 3 0.70 1700 1.6 256 48 13 272
- Pentium 3 0.80 1500 1.5 296 40 9 417
- From "Estimating IC Manufacturing Costs, by
Linley Gwennap, Microprocessor Report, August 2,
1993, p. 15
23
Summary, 1
- Designing to Last through Trends
- Capacity Speed
- Logic 2x in 3 years 2x in 3 years
- DRAM 4x in 3 years 2x in 10 years
- Disk 4x in 3 years 2x in 10 years
- 6yrs to graduate gt 16X CPU speed, DRAM/Disk size
- Time to run the task
- Execution time, response time, latency
- Tasks per day, hour, week, sec, ns,
- Throughput, bandwidth
- X is n times faster than Y means
- ExTime(Y) Performance(X)
- --------- --------------
- ExTime(X) Performance(Y)
24
Summary, 2
- Amdahls Law
- CPI Law
- Execution time is the REAL measure of computer
performance! - Good products created when have
- Good benchmarks, good ways to summarize
performance - Die Cost goes roughly with die area4
- Can PC industry support engineering/research
investment?
Recommended
CrystalGraphics Presentations


