
Research Personnel - PowerPoint PPT Presentation
1 / 34
Title:
Research Personnel
Description:
Research Personnel – PowerPoint PPT presentation
Number of Views:106
Avg rating:3.0/5.0
Title: Research Personnel
1
- CReSIS
- The Ohio State University
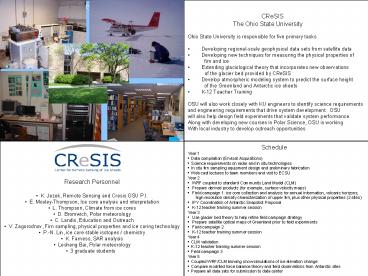
- Ohio State University is responsible for five
primary tasks - Developing regional-scale geophysical data sets
from satellite data - Developing new techniques for measuring the
physical properties of - firn and ice
- Extending glaciological theory that incorporates
new observations - of the glacier bed provided by CReSIS
- Develop atmospheric modeling system to predict
the surface height - of the Greenland and Antarctic ice sheets
- K-12 Teacher Training
- OSU will also work closely with KU engineers to
identify science requirements - and engineering requirements that drive system
development. OSU - will also help design field experiments that
validate system performance. - Along with developing new courses in Polar
Science, OSU is working - With local industry to develop outreach
opportunities
Analysis of Surface Velocity Fields
- Research Personnel
- K. Jezek, Remote Sensing and Cresis OSU P.I.
- E. Mosley-Thompson, Ice core analysis and
interpretation - L. Thompson, Climate from ice cores
- D. Bromwich, Polar meteorology
- C. Landis, Education and Outreach
- V. Zagorodnov, Firn sampling, physical
properties and ice coring technology - P.-N. Lin, ice core stable isotopes / chemistry
- K. Farness, SAR analysis
- Lesheng Bai, Polar meteorology
- 3 graduate students
- Schedule
- Year 1
- Data compilation (Envisat Acquisitions)
- Science requirements on radar and in situ
technologies - In situ firn sampling equipment design and
preliminary fabrication - Web cast lectures to team members and visit to
ECSU - Year 2
- WRF coupled to standard Community Land Model
(CLM) - Prepare derived products (for example, surface
velocity maps) - Field campaign 1 ice core collection and
analysis for annual information, volcanic
horizons - high resolution density characterization
of upper firn, plus other physical properties (2
sites) - IPY Coordination of Antarctic Snapshot
Proposal - K-12 teacher training summer session
- Year 3
- Use glacier bed theory to help refine field
campaign strategy - Prepare satellite optical maps of Greenland
prior to field experiments - Field campaign 2
- K-12 teacher training summer session
- Year 4
2
Analysis of Surface Velocity Field and
Velocity Gradients The Ohio State
University This task will measure and compile the
surface velocity fields for the polar ice
sheets. Velocity fields are already available
for portions of the Antarctic from the MAMM
project. Additional Radarsat InSAR data were
for interior Antarctica during AMM-1 and new
data about the perimeter have been collected
through 2005. Velocity gradients and derived
field will be analyzed using a proposed variant
of the conventional force budget technique.
The results will be used in comparison with
CReSIS imaging radar data to investigate
properties of the glacial bed. In addition, the
task will develop maps of Cresis study
sites using optical satellite imagery and
satellite altimeter systems. As part of this
task, the PI will visit ECSU to give
presentations on Polar Science and to interact
with students and staff. Web-based Polar Science
Seminars will also be offered.
Analysis of Surface Velocity Fields
- Research Personnel
- K. Jezek, task leader and Cresis OSU P.I.
- K. Farness, InSAR processing
- 1 graduate student will be involved with theory
development - and comparison with Cresis data
- Schedule
- Year 1 - Accomplishments
- Assemble available SAR Data and available
derived velocities - Assemble available DEM Data (Ekholm, Bamber,
IceSAT) - Initial development of complete 3-d force
theory - Year 2 - Accomplishments
- Hosted 2 ECSU students
- Completed integrated 200 m DEM of Greenland
- Create SAR mosaics and begin InSAR processing
(Envisat in progress) - Applied 3-d force theory to Antarctic MAMM
data (AGU 06) - IPY Coordination of GIIPSY (PRB 06 STG 07)
- Year 3 - Accomplishments
- Student Exchange with TUD Force balance on
Greenland Glaciers - Satellite estimates of Greenland melt
start/end/duration Field planning - GISMO Field Deployment Topography at 150 and
450 MHz - IPY Coordination of GIIPSY
- Year 4
- Finish Ascending/Descending InSAR and merge
velocity products - Compare force theory results to Greenland in
situ experiments
3
High Resolution Analysis of the Physical and
Chemical Properties of Snow and Firn using
Multiple Technologies The Ohio State University,
Ice Core Paleoclimate Group
High resolution, in situ measurements of the
physical and chemical properties of firn and ice,
along with annual snow accumulation are essential
for correct interpretation of airborne and
satellite-borne remote sensing data. Density is
one of the most difficult properties to measure
and is best evaluated in situ. At least three
different tools will be constructed, tested, and
deployed to measure density with high vertical
resolution and increased precision over current
methods. Near-surface densities that change
rapidly with depth will be given special
attention. Ideally the speedograph will be
calibrated so that many shallow (profiles can be measured quickly in a region.
This is critical as density can be highly
variable over small horizontal distances,
especially in regions where the snow facies are
not dry and the degree of melt and refreezing is
laterally variable.
Speedograph penetration is a function of density
Schedule
- Years 1 and 2 Design, Fabrication, Testing
- - High Resolution Density Setup (HIRDES) -
underway - Fabrication of the ICAS (Ice Core Analysis
System) underway - - Fabrication of Speedograph (nearly complete /
to be field tested in May 2007) - Testing all three devices with firn cores on
hand at OSU - TBD - Inter-lab calibration with Japan (Gamma Rays)
or AWI (X-rays) - TBD - Year 3 Greenland field testing, equipment
modification - Field testing HIRDES and Speedograph
(completed) - Make refinements needed as a result of field
tests (underway) - Return cores for further validation by repeat
measurements in - the cold room and laboratory analyses
underway - Year 4 Greenland field work equipment
modification - - Characterization of in situ density at
multiple field locations in Greenland - Return of some cores for further validation by
repeat measurements - in the cold room and laboratory analyses
dust, d18O and major ions - - Refine equipment as needed refurbish as
needed - Year 5 In situ density and other physical
properties at Greenland - and Antarctic field locations to support
CReSIS objectives
Research Personnel
- Ellen Mosley-Thompson - Victor Zagorodnov -
Lonnie G. Thompson - Ping-nan Lin - One graduate
student to be added in Sept 2007 to assist
with the physical analysis of cores
collected in May 2007 to support CReSIS - One
graduate student to be added in Sept 2007 to
assist in the chemical analysis of cores
collected in May 2007 synthesize the new
proxy data from the 2007 CReSIS field work
existing PARCA data.
4
Modeling System for Simulating the Elevation
Change of the Ice Sheets over Greenland and
Antarctica The development of a modeling system
to predict the surface height of the Greenland
and Antarctic ice sheets is proposed to
complement and help interpret airborne and
satellite-based measurements of ice sheet
elevation change. The modeling system will be
built on the polar version of the newly available
Weather Research and Forecasting (WRF) model that
is presently being developed by the Polar
Meteorology Group of the Byrd Polar Research
Center. The Community Land Model (CLM) that is
scheduled to be coupled to WRF in 2007 by NCAR
will be adapted to work over polar ice sheets.
For the dry snow zone, blowing snow effects as
well as densification of accumulated snow will be
considered. For the melting areas, refreezing,
runoff, and the effects of accumulated snow on
the underlying ice will be simulated. It is
anticipated that the coupled atmosphere-land
surface model will be run continuously with
assimilation of observations keeping the model
atmosphere close to reality while the land
surface albedo, snow cover on land, vegetation
description, and sea ice coverage will be updated
regularly from satellite observations. The
modeling results will be compared and contrasted
with available satellite and airborne
measurements of ice sheet elevation change,
taking advantage of area averaging of both to
enhance accuracy.
- Year 2 Accomplishments
- Evaluation of Polar WRF over Greenland ice sheet
- Development of a fractional sea-ice model for
Polar WRF - Reconstruction of 50-year Antarctic snowfall
accumulation record - Year 3 Accomplishments
- Optimization and testing of fractional sea-ice in
Polar WRF - Comparisons of IPCC Antarctic temperature and
snowfall to observations - Year 4
- CLM adapted and validated for the melting areas
to consider refreezing, runoff, and the effects
of accumulated snow on the underlying ice. - Validation of Polar WRF in Antarctica
- Year 5
- Coupled Polar WRF-CLM-Blowing snow simulations of
the surface elevation change of Greenland and
Antarctica for 2000-2008. Variations tested
against available satellite and airborne
measurements of ice sheet elevation change and
analyzed in relation to the climate controls.
Research Personnel David H. Bromwich Le-sheng
Bai Graduate student Daniel Steinhoff
5
Our vision is to educate students about the
fundamental principles of earth science and the
unique role of the polar regions in earth
systems. Our objective is to train students who
will be able to critically and creatively apply
these principles in their chosen careers. ST
outreach will be integrated into regular BPRC
activities that include annual visits by primary
and secondary school students from Central Ohio.
BPRC also hosts student groups from local
colleges and teacher organizations. BPRC is
working with McGraw Hill Company to increase
access to polar science information.
Education and Outreach
- Schedule
- Year 1 - Accomplishments
- ECSU/HINU presentations
- Continue discussions with McGraw Hill and
production of K-12 material - Jezek web cast lecture
- Numerous visits by K-12 students, teachers,
parents, college students and teachers - Proposal to Battelle to host 3 day-long climate
change session - Submit proposal to GLOBE RFP (energy budget
focus) - Invited talk at ECSU and HINU
- 2 undergrad presentations at OSU Denman Research
Forum - Year 2 - Accomplishments
- Establish BPRC Learning Center
- 2 ECSU summer students at OSU
- Lonnie Thompson web-cast lecture
- BETHA Program
- K-12 Teacher Workshop/Lesson Development
- Web Enhancement to make educational materials
available - Produce educational material from teacher
workshop - Implement Battelle-funded quarterly workshops
- Education and Outreach Team
- Carol Landis Educator
- All Senior OSU Faculty and Staff
- BPRC Administrative Staff
- One graduate student (year 2, 3)
6
CReSIS At OSU Detailed Summaries
- Airborne and Space based observations
- Ice Core Paleoclimate and Firn Properties
- Polar Meteorology
- Education and Outreach
7
Surface Velocities and Basal ImagingYear 3
Progress Report
- Student Projects
- GISMO
- GIIPSY
- Publications/Presentations
8
CReSIS Remote Sensing Teaching and Students at OSU
Lucas Beem (Geology) Basal Melting
Summer exchange student at
TUD Indra Bhattacharya (Geology) Surface
properties of the Greenland Ice
Sheet Noppasin Niamsuwan (Electrical
Engineering) Surface Scattering
SAR seminar co-taught with KU
9
Greenland Ice Sheet Snow Surface Properties
We are investigating spatial and temporal
patterns of Greenland Ice Sheet surface
properties using passive microwave data. We
estimate dry snow zone surface accumulation rate
using an algorithm developed by Bolzan and Jezek.
We estimate surface melt using a modified
version of the wavelet based edge detection
algorithm (Wang and others 2005) applied to
individual sectors of the ice sheet. The melt
results are useful for planning field campaigns
and are of interest in testing hypotheses about
the relationship between surface melt and outlet
glacier acceleration. 2005 Wang, L., H. Liu and
K. Jezek. Wavelet transform based edge detection
approach to derivation of snowmelt onset, end and
duration from satellite passive microwave
measurements. International Journal of Remote
Sensing, vol. 26, no. 21, p. 4639-4660
10
Annual Variation in Passive-Microwave-Derived
Melt Start Date
These plots show annual melt start dates and
their variation with elevation for Greenland
glaciers. There is only a weak suggestion of
earlier melt date on the eastern flank of the ice
sheet. No trends are evident on the western
flank.
11
Elevation Dependence of Passive-Microwave-Derived
Melt Start/end Date
These plots show the elevation dependence of melt
start/end dates and their annual variation There
are only weak trends in the data, especially on
the western flank of the ice sheet.
12
Annual Variation in Passive-Microwave-Derived
Melt duration
These plots show annual melt duration days and
their variation with elevation for Greenland
glaciers. Although many of these glaciers have
accelerated, there are no strong trends in the
data.
13
Annual Variation in Passive Microwave Derived
Melt end date
14
A NASA/NSF collaboration to build an instrument
that images Greenland and Antarctica as they
would appear were the ice sheets stripped away
GISMO/CReSIS
15
Left/right side interferogram separation
Left side interferogram
Right side interferogram
16
May 2006 GISMO Flight, 150 MHz, InSAR Swath
Measurements of Topography Beneath the Greenland
Ice Sheet
Basal topography measured along a 25 km flight
line and across a 3 km swath over the western
Greenland Ice Sheet in May 2006. Thickness was
measured using an airborne 150 MHz Synthetic
Aperture Radar. The data were processed to
simultaneously image the left and right sides of
the aircraft. Thickness was subtracted from
ICEsat surface elevation data to compute basal
topography.
left
right
17
450 MHz GISMO interferogram
19 km
1.3 m baseline
1 km in air
18
Topography from 450 MHz Depth Mode Data
Data gaps
19
- GIIPSY
- Use the international constellation of remote
sensing satellites to acquire snapshots of the
Arctic and Antarctic. - Use these snapshots as gauges for comparing past
and future environmental changes. - In the spirit of the IGY, secure these data sets
as our legacy to the next generations of polar
scientists.
- Global Interagency IPY Polar Snapshot Year
- Participating International Agencies NSF, NASA,
NOAA, ESA, DLR, EUMETSAT, CSA, CMA, ROSHYDROMET,
WMO, WCRP-CLiC - Accomplishments
- - Contributor to IGOS-Cryosphere Report
- Coordinated development of Science Requirements
- Interagency SAR workshop organization
objective is - a distributed data acquisition plan
- Papers submitted to EARTHZINE and Space
- Research Today
20
Knowledge Transfer and Service
- Publications
- 2007 Liu, H., J. Yu, Z. Zhao and K. Jezek.
Calibrating and mosaicking surface velocity
measurements from interferometric SAR data with
simultaneous least-squares adjustment approach.
International Journal of Remote Sensing, vol 28,
no. 6 p. 1217-1230. - 2007 Liu, J., J. Wen, Y. Wang, W. Wang, B.
Csatho, and K. Jezek. Development and
applications of dome A-DEM in Antartic Ice Sheet.
Chinese Geographical Science, vol 17, no 2. - 2007 Van der Veen, C., K. Jezek, and L. Stearns.
Shear measurements across the northern margin of
Whillans Ice Stream. J. Glac, vol. 53, no 180,
p. 17-29 - 2007 Liu, H., Z. Zhao, and K. Jezek. Synergistic
fusion of interferometric and speckle-tracking
methods for deriving surface velocity from
interferometric SAR data. IEEE. Geoscience and
Remote Sensing Letters, vol 4, no. 1. p. 102-106. - 2007 Wuite, J., and K. Jezek. Evidence of past
fluctuations on Stancomb-Wills ice tongue,
Antarctica, preserved by relict flow stripes. J.
Glac., submitted - 2007 Jezek, K.C. Antarctica A continent
revealed. In Our Changing Planet The View from
Space, M. King, C. Parkinson, K. Partington, and
R. Williams eds, p209-213. Cambridge University
Press, New York. - 2007 Liu, H., Z. Zhao, and K. Jezek, 2007.
Synergistic fusion of interferometric and
speckle-tracking methods for deriving surface
velocity from interferometric SAR data. IEEE.
Geoscience and Remote Sensing Letters, vol 4, no.
1. p. 102-106. - 2007 Wen, J., K. Jezek, B. Csatho, U. Herzfeld,
K. Farness, and P. Huybrechts, 2007. Mass
budgets of the Lambert, Mellor and Fisher
Glaciers and basal fluxes beneath their flowbands
on Amery Ice Shelf. Science in China Series D
Earth Sciences. 50(11), p. 1693-1706. - 2008 Wuite, J., K. Jezek, X. Wu, K. Farness and
R. Carande, 2007. The velocity field and flow
regime of David Glacier and Drygalski Ice Tongue,
Antarctica. Polar Geography, submitted - 2008 Wen, J, Y. Wang, J. Liu, K. Jezek, P.
Huybrechts, B. Csatho, K. Farness, B. Son, 2008.
Mass budget of the grounded ice in the Lambert
Glacier Amery Ice Shelf system. Accepted, Annals
of Glaciology 48 (48A028). - 2007 Jezek, K.C. and M. Drinkwater. Global
Interagency International Polar Year Polar
Snapshot Year (GIIPSY). ASF News and Notes,
Summer 2007, Vol 42, p. 2-3. - 2007 Jezek, K.. Surface roughness measurements
on the western Greenland Ice Sheet. BPRC
Technical Report, 2007-01, 20 p. - Presentations
- 2007 Jezek, K.C., K. Farness, and M. Drinkwater.
Global Interagency IPY Polar Snapshot Year
Goals and Accomplishments. Geophysical Research
Abstracts, Vol 9. 01444, EGU, Vienna. - 2007 Scambos, T., T. Haran, M. Frezzotti, K.
Jezek, D. Long and K. Farness. Mapping East
Antarctic snow accumulation at high resolution
from space. EOS. Trans. AGU 88(52), Fall Meeting
Suppl, Abstract C11C-05 - 2007 Gogineni, P., C. Leuschen, J. Li, A. Hoch,
F. Rodriguez-Morales, J. Ledford, and K. Jezek.
Array processing for radar clutter reduction and
imaging of ice-bed interface. EOS Trans. AGU,
88(52) Fall Meeting Suppl. Abstract P14B-07. - Other
- Member, IPY Subcommittee on Observations
21
Polar Meteorology GroupYear 3 Progress Report
- Polar WRF testing with Arctic Ocean sea ice from
SHEBA case studies - Polar WRF verification in Antarctica
- Antarctic temperature and snowfall simulations in
IPCC climate models
22
Polar WRF
Weather Research and Forecasting Model
Polar Optimization Fractional sea
ice Sea ice albedo Morrison microphysics
(2-moment) Noah LSM modifications Heat transfer
through snow and ice
SHEBA 1997/8 Grid
January 1998 Results
23
Test Polar WRF for Arctic Ocean/sea ice with
selected SHEBA case studies (1997/1998)
SHEBA Location (from Perovich et al. 2007)
24
Albedo as a function of Julian day for 1998.
Thick light blue line shows the area-average
albedo from transect observations. Thin blue line
shows the locally-measured albedo at the SHEBA
tower. The red line is the Polar WRF value
interpolated to Ice Station SHEBA.
25
90
Snow Melt Onset (from NSIDC data)
82
80
Sea Ice Transition
CSM maximum snow albedo (Weatherly et al. 1998)
70
CSM minimum sea ice albedo (Weatherly et al. 1998)
60
50
50
40
Day 0
Day 35
Prescribed Albedo Trend for June 1998 Simulation
26
August Treat Arctic melt ponds as component of
open-water fraction. Run Noah LSM for Arctic bare
ice fraction. Take albedo as 0.65 for 01 August
to 13 August. Linearly increase albedo to 01
September (freezeup stage).
27
Polar WRF simulations of surface pressure feature
excellent results compared to SHEBA observations
for all three simulation months
28
Polar WRF simulations of surface temperature also
feature good agreement with observations,
especially considering difficulties of simulating
localized ice and water clouds
29
Polar WRF Verification for Antarctica
- Work is commencing on verification of Polar WRF
in Antarctica - Initial tasks in progress
- Obtaining initial and boundary conditions from
ERA-40, NCEP - Implementing RADARSAT Antarctic Mapping Project
Digital Elevation Model (RAMP DEM) topography
data - Sea-ice fraction data from NSIDC
- One-year Polar WRF model run will be compared
with available AWS observations, upper-air
observations, precipitation measurements - In conjunction with previous verification work
for Greenland, Polar WRF will be suitable for
polar ice sheet mass balance simulations
30
IPCC temperature and snowfall simulations in
AntarcticaMonaghan et al. (2008)
- Annual snowfall trends agree with observations,
but near-surface temperature trends too large - Overestimated temperature trends may be due to
unrealistic increases in water vapor, enhancing
longwave radiative forcing at surface - Results diminish confidence in 21st century
predictions of both temperature and snowfall in
Antarctica by climate models
31
Publications, Presentations, Grad Students
- Publications
- Bromwich, D. H., J. E. Box, R. L. Fogt, and A. J.
Monaghan, 2007 Contributors to the Antarctic and
Nordic sections of 'State of the Climate in
2006'. Bull. Amer. Meteorol. Soc., 88, s72-s74,
s104-s106. - Bromwich, D. H., R. L. Fogt, and A. J. Monaghan,
2007 Climate Change 2007, The Physical Science
Basis. Contribution of Working Group I to the
Fourth Assessment Report of the Intergovernmental
Panel on Climate Change. Edited by S. Solomon, Q.
Dahe, M. Manning, M. Marquis, K. Averyt, M. M. B.
Tignor, H. L. Miller, and Z. Chen, Cambridge
University Press, 996 pp. Contributing authors to
Chapter 3 (Observations Surface and Atmospheric
Climate Change), Chapter 4 (Observations Changes
in Snow, Ice and Frozen Ground), and Chapter 11
(Regional Climate Projections). - Bromwich, D. H., K. M. Hines, and L.-S. Bai,
2008 Development and testing of Polar WRF. Part
II. The Arctic Ocean. J. Geophys. Res., in
prep. - Hines, K. M., and D. H. Bromwich, 2008
Development and Testing of Polar WRF. Part I.
Greenland Ice Sheet Meteorology. Mon. Wea. Rev.,
in press. - Monaghan, A. J., and D. H. Bromwich, 2008
Advances in describing recent Antarctic climate
variability. Bull. Amer. Meteorol. Soc.,
provisionally accepted. - Monaghan, A. J., D. H. Bromwich, and D. P.
Schneider, 2008 20th century Antarctic air
temperature and snowfall simulations by IPCC
climate models. Geophys. Res. Letts.,
provisionally accepted. - Monaghan, A. J., D. H. Bromwich, W. Chapman, and
J. C. Comiso, 2008 Recent variability and trends
of Antarctic near-surface temperature. J.
Geophys. Res., in press. - Ye, H., E. J. Fetzer, D. H. Bromwich, E. F.
Fishbein, E. T. Olsen, S. Granger, S.-Y. Lee, L.
Chen, and B. H. Lambrigtsen, 2007 Atmospheric
toal precipitable water from AIRS and ECMWF
during Antarctic summer. Geophys. Res. Lett., 34,
L19701, doi10.1029/2006GL028547. - Presentations
- S4D Workshop, Paris France, October 2007
- Polar Climate Working Group Meeting, NCAR,
Boulder CO, January 2008 - 3rd WCRP International Reanalysis Conference,
Tokyo Japan, February 2008 - DAMOCLES Workshop, Iceland, February 2008
- Grad Student
- Daniel Steinhoff (M.S., Atmospheric Sciences)
Influence of coastal cyclogenesis on ice sheet
mass balance (CReSIS Funded)
32
Education and Outreach Year 2 Progress Report
- Tours and Visits
- Summer Teacher Workshop
33
Educational Outreach Participation - CReSIS
Project Byrd Polar Research Center The Ohio State
University February 2007-February 2008
34
(No Transcript)
Recommended
CrystalGraphics Presentations


