
Location and Spread - PowerPoint PPT Presentation
1 / 16
Title:
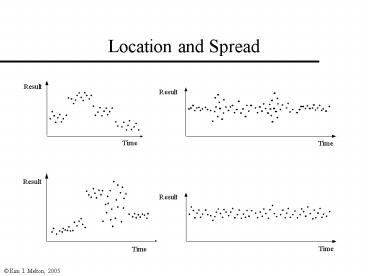
Location and Spread
Description:
Kim I. Melton, 2005. Using Excel to Calculate X-Bar and R ... Kim I. Melton, 2005. Interpreting Results. When the Process is Judged to be Stable ... – PowerPoint PPT presentation
Number of Views:70
Avg rating:3.0/5.0
Title: Location and Spread
1
Location and Spread
2
Insurance Quotes
- An insurance company staffs quote lines so that
independent agents can call in for quotes on
insurance. The following data represent the time
(in seconds) for one operator to respond to five
consecutive calls from the same state. One
subgroup (of five observations) is collected each
day.
3
The Data
4
X-bar and R charts
5
Using Excel to Calculate X-Bar and R
- Assume that the data for the first subgroup are
in cells B2, C2, D2, E2, and F2 - If you want to put X-Bar for this subgroup in
cell I2, then click on cell I2 and type - average(B2F2)
- If you want to put R for this subgroup in cell
J2, then click on cell J2 and type - max(B2F2)-min(B2F2)
- Copy the formulas down the column to find the
corresponding values for each subgroup
6
Control Limits
If the process appears to be stable, then
7
Interpreting Results When the Process is Judged
to be Stable
- Recall that control limits deal with the expected
range of variation for the characteristic plotted
on the control chart. - Therefore, the limits on the X-bar chart deal
with the expected range of variation for subgroup
averages. - Natural process limits, expected ranges for the
individual values, can be calculated as
8
Limits
- Control Limits (LCL and UCL)
- calculated from data collected from the process
- used to assess stability of the process
- related to the characteristic plotted (e.g.,
X-Bar or R) - Natural Process Limits (LNPL and UNPL)
- only calculated if the process appears to be
stable - related to measurements for individual items
- provides information about range of measurements
for individual items that can be expected - Specification Limits - Specs (LSL and USL)
- determined by the user based on desired or needed
measurements for an item - related to desired (acceptable) range of
measurements for individual items
9
Call Center Goals
- Suppose that management of the Insurance company
wants quotes times to be between two minutes and
four minutes. (They believe any times below two
minutes will be rushed and unfriendly, and times
above four minutes would discourage future
business.) - With the current process, what proportion of the
calls would you expect to take more than four
minutes?
10
Call Center Ads
- Suppose the manager wants to create an ad telling
people how quickly they can provide a quote. The
manager wants to include a statement along the
lines ofIf you call us, our agent will
provide you with a quote in less than ________
minutes.What number should be placed in the
blank?
11
Process Capability
- To talk about capability of a process, we must
have stability - Capability refers to the voice of the process
- The capability of the process tells the range of
values that can be expected for the measurements
of some process characteristic - Specifications (specs) provide a voice of the
customer. - Capability indexes are a fairly common way of
communicating the relationship between
specifications and process performance. - Capability indexes attempt to compare the voice
of the process with the voice of the customer.
12
Two Approaches to Talking about Capability
- Approach 1
- Comparison of Engineering Tolerances to Natural
Tolerances - Engineering Tolerances refer to the
specifications for the characteristicET USL -
LSL - Natural Tolerances refer to the natural process
limits for the characteristicNT UNPL - LNPL
(where natural process limits are calculated as m
3s and s is estimated by Rbar/d2 from a stable
process) - If NT
- If NT within the specification limits, we say the
process is capable and meeting spec.
13
Capable but Not Meeting Specs???
- When capability is described in terms of the
amount of variation (without looking at
location), a process with very little variation
could consistently produce unacceptable product. - Example
- Nails are sold by weight, but builders need to
know how many nails are contained in boxes of a
given weight. Suppose a builder specifies that
each box of nails should contain 990 to 1010
nails (i.e., 1000 10). - The producer has reduced the variation in the
weight of nails to the point where there is only
a difference of 1 to 4 nails from one box to
anotherbut, boxes actually contain 983 to 987
nails.
14
Capability (cont.)
- Approach 2
- Capability Indexes
- Cp tells us if the natural variation is smaller
than the allowed variation. Cp does not look at
process location therefore it is possible to
have a good Cp and be making large amounts of
unacceptable product. - Cpk tells us if the natural variation is small
enough and far enough from the specifications
for most product to meet specs for the
characteristic. Cpk cannot be larger than Cp.
15
Capability Formulas
If the process is centered between the specs
Cpk
16
Histogram Patterns
Recommended
CrystalGraphics Presentations


