Terrain modeling and analysis workflow - PowerPoint PPT Presentation
1 / 8
Title:
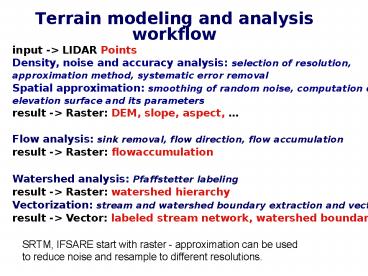
Terrain modeling and analysis workflow
Description:
Density, noise and accuracy analysis: selection of resolution, ... acquired just 2 days before and 3 days after the hurricane Isabel landfall; ... – PowerPoint PPT presentation
Number of Views:84
Avg rating:3.0/5.0
Title: Terrain modeling and analysis workflow
1
Terrain modeling and analysis workflow
SRTM, IFSARE start with raster - approximation
can be used to reduce noise and resample to
different resolutions.
2
Improving stream data
3
IFSARE and SRTM data analysis
High resolution IFSARE and global SRTM DEMs
routine need for analysis on large raster
DEMs Traditional approach overlapping tiles
(time consuming, manual intervention needed to
ensure proper location of tiles in relation to
watersheds) Our approach process the entire area
in a single run (tile the results after
processing if needed) Example stream and
watershed boundary extraction was needed for
Panama - existing data were inadequate for
on-going water quality research. SRTM - 7400x3600
DEM at 90m res. for entire Panama, IFSARE -
10800x11300 DEM at 10m res. for the Panama canal
section Our approach - streams can be extracted
in 3-4 hours, tile-based approach takes days
SRTM DEM for entire Panama with main rivers
extracted from DEM in 3 hr
4
Stream networks from SRTM and IFSARE
Detail of stream networks from SRTM 90m and
IFSARE 10m DEMs patched together and
reinterpolated to 30m resolution
Zoomed into the detailed stream network and
watershed boundaries from SRTM DEM
only SRTM (90m) available here
both IFSARE (10m) and SRTM (90m) available for
this section
High efficiency in processing allows us to
produce maps at different levels of detail
depending on application requirements
5
Methodology for topographic change
- Data integration coordinate system
transformation - Point density and noise analysis selection of
common resolution and gridding method - Simultaneous spatial approximation (gridding),
smoothing of random noise and computation of
topographic surface parameters - Detection of systematic error and its elimination
for all DEMs - Definition of topographic change measures -
dependent on application and geomorphology (e.g.
shoreline erosion, change in slope, change in the
structure of stream network, elevation change) - Extraction of features used to measure the change
(shoreline, ridges, streams, peaks, crests, ) - Quantification of change, generation of
topographic change maps
6
North Carolina Lidar Surveys
- During the previous briefing we have presented
analysis of large back-barrier island sand dune
migration using combination of photogrammetric,
lidar and RTK-GPS data quantified using migration
of crests, ridges, peaks, volume and area change. - New study development of methodology for
quantification of dynamics of barrier island
system that includes complex interactions between
inlet, beach, foredune and road using the
following 10 lidar surveys acquired by 4
different lidar systems - 2005 USACE Topo/Bathy Mapping after hurricane
Ophelia, SHOALS - 2004 USACE Topo/Bathy Mapping, SHOALS
- 2003 June, Sept. 18 and Sept. 21, includes pre-
and post-hurricane Isabel survey by NASA/USGS
EAARL, acquired just 2 days before and 3 days
after the hurricane Isabel landfall - 2001 (Phase I) North Carolina Floodplain Mapping
survey. - 1996-2000 Five lidar surveys by USGS/NASA/NOAA
2 ATM II sensor
7
Increasing LIDAR point density
no. of points/2m grid cell 1996 0.2 1997
0.9 1998 0.4 1999 1.4 2001 0.2 NCflood 2003
2.0 2004 15.0 2005 6.0
substantially improved representation of
structures but much larger data sets
2004 lidar, 0.5m resolution DEM binned and
computed by RST (smoothes out the noise and
fills in the gaps
1m resolution DEM from 1998 lidar data computed
by RST
examples are from 2 different locations on NC
coast
8
Shifts in Lidar Surveys
original blue 1999 black 2001 A erosion 12m B
accretion 2m corrected red 1999 violet
2001 A erosion 4m (!) B accretion 8m
Elevation difference in lidar data computed along
centerline of a stable road indicates systematic
error that can significantly influence estimates
of shoreline erosion and sand volume change
A
B


