
Figure 2. Geographic and Seasonal Distribution Version 000615 - PowerPoint PPT Presentation
1 / 19
Title: Figure 2. Geographic and Seasonal Distribution Version 000615
1
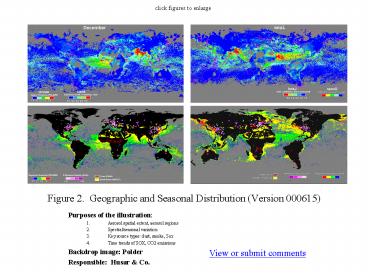
Figure 2. Geographic and Seasonal Distribution
(Version 000615)
click figures to enlarge
- Purposes of the illustration
- Aerosol spatial extent, aerosol regions
- Spectral/seasonal variation
- Key source types dust, smoke, Sox
- Time trends of SOX, CO2 emissions
- Backdrop image Polder
- Responsible Husar Co.
View or submit comments
2
Figure 2. Geographic and Seasonal Distribution
(Version 000611)
click figures to enlarge
3
Figure 2. Geographic and Seasonal Distribution
(Version 000607)
click figures to enlarge
4
Fig 2 Draft 1
- This is an initial crude rendering of the
continents for the geographic distribution figure
5
Scrapbook
- The remainder pages show images used or
considered for this Figure
6
POLDER aerosol optical depth over the oceans
7
POLDER Angstrom exponent
8
SOx, Dust, Smoke Emissions
- IGAC - GEIA Sulfur Emissions
9
Fires (IONIA)
10
Sand Dunes (red)
11
Population Density,NASA GISS
- Population Density, National Geographic
12
POLDER Aerosol Index over Ocean and Land
13
POLDER aerosol optical depth over the oceans
14
POLDER Angstromexponent
15
Ship Haze
- 1938 Ship Haze maps based on McDonald, 1938
16
Global Visibility
17
(No Transcript)
18
Regional Trend of Energy Use, C and S Emissions
19
Regional Emission Trends
- Regional Carbon Dioxide Emission Trends.
Regional Sulfur Dioxide Emission Trends.
Recommended
CrystalGraphics Presentations


